Festivals Toolkit
Building Knowledge – Audience Data Collection
In January 2020 Jordan Brandt from the Mass Voter Table presented a session on data collection basics for the Festivals Audience Lab. The content makes use of the content from that session.
Why Collect Audience Data?
Traditional methods of reaching out to people are very expensive. For example, you could spend money for a billboard. Maybe less than 1% of people who see the billboard are interested in what you’re showing them, but you’re still paying for everyone to look at it. This is also true for television or any type of general, broad-based marketing.
Now we’re in a place where we can reach out to people on an individual level, through channels like social media (e.g., Facebook), which really opens up a whole new world for organizations that have limited marketing budgets. We need to understand something about our audiences in order to focus this individualized reach well. This means we have to be mindful about collecting data about them.
Understanding your audience is critical to efficiently expand it. If you know your event is popular with city-dwelling college students, there’s little sense in targeting/advertising to senior citizens in rural areas.
What Data Should You Collect? (data collection exercise)
Before you can begin collecting data about your audience, you need to understand exactly what it is you want to collect. Some questions to consider in order get started:
- What is your goal?
- How can data help you achieve your goal and/or understand whether you’ve accomplished your goal?
- How are you going to use the data?
- What is the specific data you need to collect?
- What methods can I use to collect data?
- How quickly do I need to record the data?
- How much information is my audience willing to provide?
- What system is the most appropriate to collect your data?
Example 1. Let’s think through these questions with a simple example. Let’s say you have an email newsletter, which you send out every month using MailChimp. This is your primary means of communicating and you would like to increase the number of people who receive it. In order to do that you need to collect more email addresses and you can measure your success by counting the number of new ones you collect. In the past you’ve had good success with asking festival attendees to stop at the welcome table and write down their email address, so you plan to do that again this year. Since this information will only be used to send out the newsletter, you don’t need a separate database but can just store the email addresses in MailChimp. Since the emails collected at the festival were written down on paper you will need a volunteer to enter them into your system before the next newsletter goes out.
Remember that only actionable data should be collected. While it may be interesting to know someone’s favorite color or astrological sign, if you aren’t going to do anything with that information you shouldn’t be collecting it. Asking for too much information slows collection and can tire or frustrate the provider. Notice in the previous example you don’t even ask for someone’s name, because you only need their email address to add them to the distribution list.
Example 2. Let’s now consider a second example where you might want to collect a lot more data. Let’s say you are writing a grant application that asks you how many people come from outside your community and what the demographic breakdown looks like with regards to age, gender, race/ethnicity, and household income. You realize that having this information would also be helpful for your marketing, to understand where and how to target your efforts. However, that is a lot of sensitive information and you don’t want to try to ask your attendees for all of it. You find a market research firm that offers a demographic analysis service (see the demographic analysis example), and they tell you they can provide the information you need if you submit a spreadsheet with the names and mailing addresses of at least 100 attendees. Your festival requires tickets to attend, so you decide to set up your online ticketing system to collect this information when people purchase tickets. You can easily download from your ticketing system a spreadsheet of the data that the market research firm needs.
How Can You Collect Data?
The two examples illustrated different methods for collecting data, based on the specific needs described. Most of your needs will require collecting data about your attendees, either before or during your event.
Collection Methods
Example of a good form: This should go to the postcard from the Mass Voter Table (on p33 of the original document)
| Type | Examples | Advantages | Disadvantages |
| Paper | Example of a good form |
|
|
| Digital | Eventbrite (example) Google Forms Survey Monkey Facebook Events |
|
|
| Secondary (market research firm) | Claritas |
|
|
| Custom | Tessitura |
|
|
Tips for collecting data using a digital form:
- Use a user-friendly website and encourage or require attendees to register ahead of time, even if the event itself is free.
- Require the fields that you want to collect data for.
- Set up the tickets to collect information for each person attending, not just the person purchasing the tickets.
- Set up station at the event for so attendees who do not register in advance can provide their data
Tips for collecting data in person at an event:
- Train staff/volunteers to collect complete and accurate information
- Set up a sign-in table or station near a natural bottleneck to encourage foot traffic
- Have staff/volunteers collecting information float around, especially near the back of lines
- If using a paper form, make copies of all completed forms
- If using a digital form, make sure to have a computer or tablet at all events
Improving Data Quality
Poorly captured data cannot be analyzed or linked to other datasets. Inaccurate data, such as incorrect email addresses or other contact information, creates waste and unnecessary expense when your communications fail to reach their intended audience. Inaccurate data, such as incorrect demographics, means that you cannot accurately describe your audience.
You can improve data accuracy by checking and correcting for common errors:
- Email addresses must contain one “@” symbol and at least one “.”
- Phone numbers cannot contain letter or any special characters except dashes.
- Domestic phone numbers must be exactly 10 characters in length.
- Names cannot contain numbers or special characters.
- Names should not be for more than one person.
How you capture and store data can have an enormous impact on your ability to analyze it. The examples presented below are from two festivals who submitted their data1 for analysis by an outside market research firm, with the goal of linking to another dataset and adding demographic information. The presentation of your data affects how these two datasets can interact with each other. The match rate is the percentage of festival records that could be matched with the other dataset.
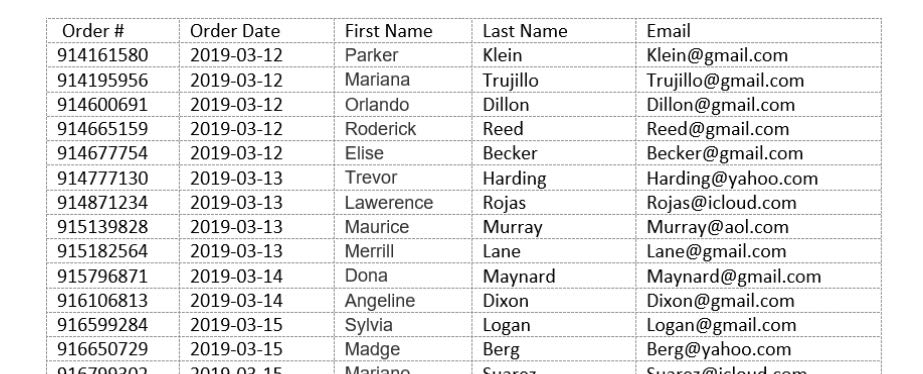
Festival 1: Data accessed from Eventbrite
0% Match Rate
1 All identifying information has been edited and anonymized.
The data submitted by this festival was collected in Eventbrite and exported as a PDF document. This resulted in a 0% match, because it is not possible to connect to another dataset using information provided in this way. When exporting data from Eventbrite or another vendor platform, you want to make sure to end up with a spreadsheet, never a PDF.
Festival 2: Data kept in a spreadsheet
39% Match Rate
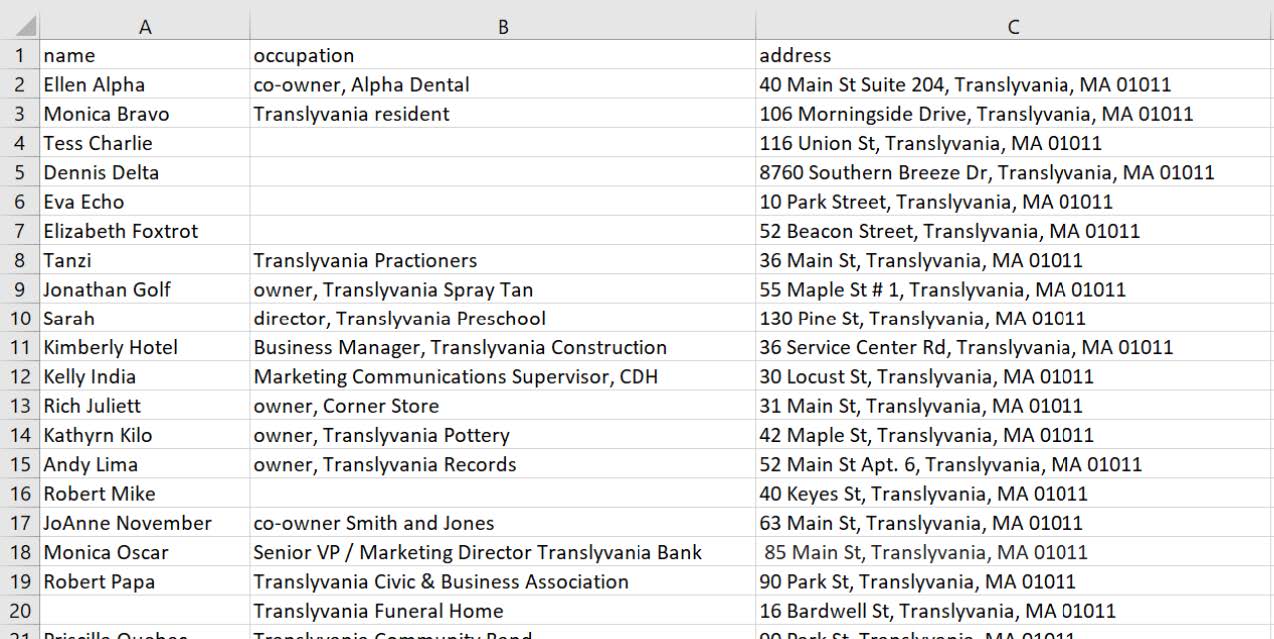
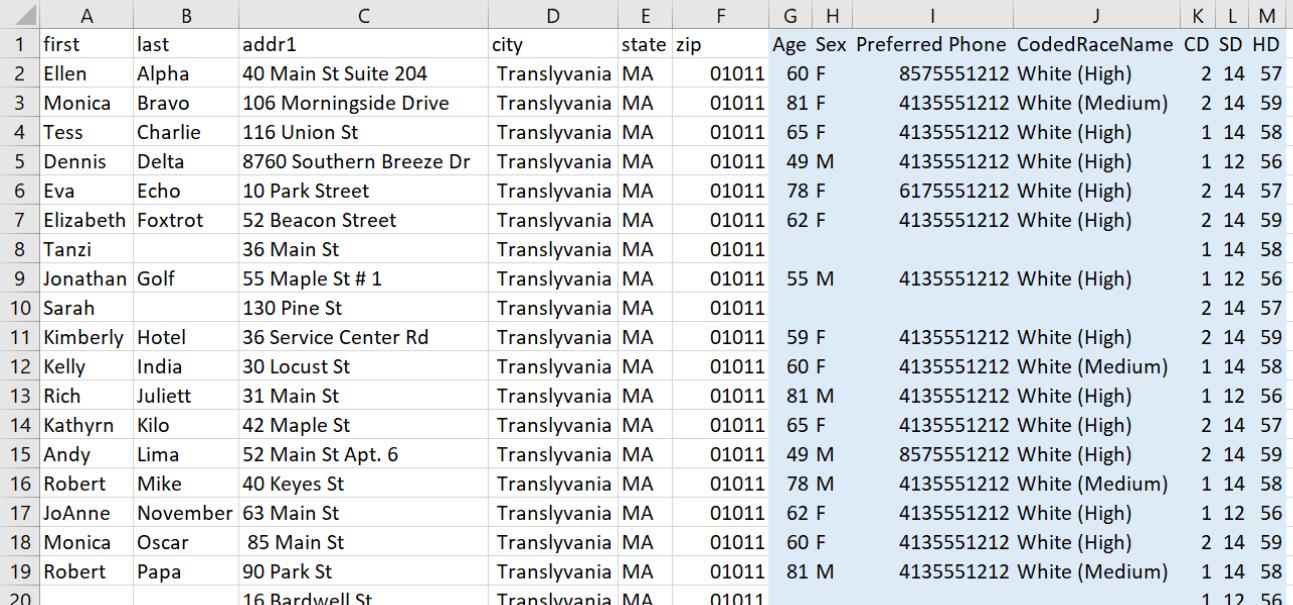
The data submitted by this festival is kept in an Excel spreadsheet. Fewer than half the records were able to be matched. However, cleaning up the data can improve the match rate. Using the same information, the match rate improves considerably when separating different pieces of information into separate columns. In the example below, the data is still kept in an Excel spreadsheet, but the format has been changed to make analysis easier. This format also makes it more obvious what information is missing.
82% Match Rate

By using an outside market research firm and matching their dataset with yours, the data below in blue is new data available to us. Here we’ve added age, gender, phone numbers for almost all attendees and filled in missing addresses. We also have race data as well as legislative district information.
Dataset After Matching