
2024 Massachusetts Cultural Asset Inventory
Summary Report
“Artists and cultural organizations fuel our economy, communities, and identities as a vital health and human service—yet too many are barely getting by. This inventory is a wake-up call. Government must act with bold policy solutions. The sector must rethink its models and practices. Arts education institutions must equip students with essential business skills. Consumers must turn love into advocacy. The private sector must invest and insist on integrating the creative economy as a driver of innovation and growth. Without this work, Massachusetts risks losing its competitive edge and unique identity. Who is ready to roll up their sleeves?”
– Michael J. Bobbitt, Executive Director of Mass Cultural Council
Introduction
Mass Cultural Council worked with Diversity North Group to design, create, share, and use a Massachusetts Cultural Asset Inventory to describe, understand, and direct policy and support to individuals and organizations that populate the state’s cultural sector. The project took place February – December 2024. You can read more about the conceptual framework and methodology in the full Diversity North Group final report (PDF).
Summary of Findings
Through the project we uncovered a wealth of rich and interesting data and information. Including these key findings which will be discussed in greater detail below:
- The cultural sector is large, we have identified 15,063 cultural organizations (and that is most likely lower than the true total number).
- Only about half of the organizations are nonprofits.
- Of the 973 organizations found in the 990s, nonprofit cultural organizations employ 24,894 people, making a vital contribution to the Massachusetts economy through $929,450,618 in salaries and wages.
- There are at least 112,190 generators (individuals making half their income or more from 36 arts, humanities, science occupations) across the state, which is 3% of the Commonwealth’s workforce.
- The individual median income of generators is $49,182, which is well below the state’s individual living wage of $58,011 as calculated by the MIT Living Wage Calculator in December 2024.
- Of the 36 occupations, 28 occupations’ individual median income is below the state’s living wage.
- Income inequity persists for women, people who are BIPOC, immigrants, and people with disabilities.
Comparison with Existing Federal Data
The most recent federal data made available (2022) by the National Endowment for the Arts and the U.S. Bureau of Economic Analysis reported 133,773 jobs in Massachusetts related to cultural production. Between individual generators and cultural workers at nonprofits we have identified at least 137,084 jobs (4% of the state’s workforce) related to cultural production in Massachusetts, but the actual number is much higher. Our generator inventory and count of cultural workers DOES NOT INCLUDE:
- Individuals who may consider themselves professional artists, earning less than half their income from these artistic occupations or working unpaid.
- K-12 and college/university teachers in arts, humanities, and sciences.
- Individuals working at 14,090 cultural institutions in other professions (e.g., administrators, front of house staff, etc.). We only have employee data from 973 nonprofits.
Partners
Mass Cultural Council is grateful to the partners, funders, and data contributors who made this project possible:
- American Association for State and Local History
- Arts Connect International
- Arts Foundation of Cape Cod
- Assets for Artists
- Berkshire Taconic Community Foundation
- Board of Library Commissioners
- Cambridge Community Foundation
- Community Foundation for MetroWest
- Community Foundation of Western Massachusetts
- Converse
- CreativeGround, a project of the New England Foundation for the Arts
- Essex County Community Foundation
- Greater Lowell Community Foundation
- Greater Worcester Community Foundation
- MASSCreative
- Mass Humanities
- SouthCoast Community Foundation
- The Boston Foundation
- The New Commonwealth Racial Equity & Social Justice Fund
- Worcester Cultural Coalition
Organizations & Programs
Methodology
We identified arts, humanities, and interpretive sciences organizations across Massachusetts, including those within larger entities. While all organization types were included, publicly available data made nonprofits more accessible, resulting in a more comprehensive nonprofit representation. Additional efforts are needed to fully capture for-profit, unincorporated, and public entities, including tribal, state, and municipal organizations.
A detailed methodology and definition of terms can be found on slides 21-29 of the Diversity North Group final report (PDF).
Types of organizations & programs included in the Inventory:
Organizations
- Nonprofit organizations
- For-profit organizations
- Unincorporated organizations
- Educational organizations
- Cooperatives
- Local Cultural Councils
Programs
- Programs within municipalities
- Programs within for-profit organizations
- Programs within educational organizations
- Programs embedded in cultural private organizations
- Programs embedded in cultural or non-cultural public agencies
- Programs embedded in non-cultural private organizations
Data Sources:
- Mass Cultural Council: 5,751 records
- CreativeGround: 6,810 records
- Nonprofit 990: 4,306 records
- List 4 (various sources): 1,001 records
- Libraries: 1,503 records
Total = 17,859 including overlap/duplicates
Additional information about how many records were found in each data source can be found on slides 18-19 in the Diversity North Group final report (PDF).
Findings
Through those five sources of data, we found 15,063 cultural organizations and programs across the Commonwealth.
Geographic distribution
|
County |
Count |
|---|---|
|
Barnstable, Dukes & Nantucket Counties |
896 |
|
Berkshire |
622 |
|
Bristol |
754 |
|
Essex |
1,437 |
|
Franklin |
464 |
|
Hampden |
785 |
|
Hampshire |
761 |
|
Middlesex |
3,664 |
|
Norfolk |
1,209 |
|
Plymouth |
745 |
|
Suffolk |
2,315 |
|
Worcester |
1,411 |
|
TOTAL |
15,063 |
TABLE 1. This table gives the count of organizations and programs by county.
Organization Type
Organizations had a diverse range of legal statuses as well. Based on the database we were able to identify the following organization types. In some cases, the legal status was self-reported by the organization and this self-reported data has not been verified.
Nonprofit: Includes federally recognized tax exempt organizations as well as organizations incorporated as non-profit organizations with the Massachusetts Secretary of the Commonwealth.
For-Profit: Includes cooperatives, corporations, partnerships. Does not include sole proprietors.
Public: Includes Tribal, state, and municipal entities including Local Cultural Councils, libraries, and other government cultural organizations and programs.
Unincorporated: Includes organizations that self-identify as unincorporated that were not found in the publicly available 990 data or had not been found in the Massachusetts Secretary of the Commonwealth’s business entity database.
No Data: Includes organizations that were not in CreativeGround, Mass Cultural Council’s database, or the 990 data and as such no additional legal status data was available.
|
Legal Status |
# of Organizations |
|
Nonprofit |
7,894 |
|
For-Profit |
2,520 |
|
Public |
2,115 |
|
Unincorporated |
1,961 |
|
No Data |
573 |
|
Total |
15,063 |
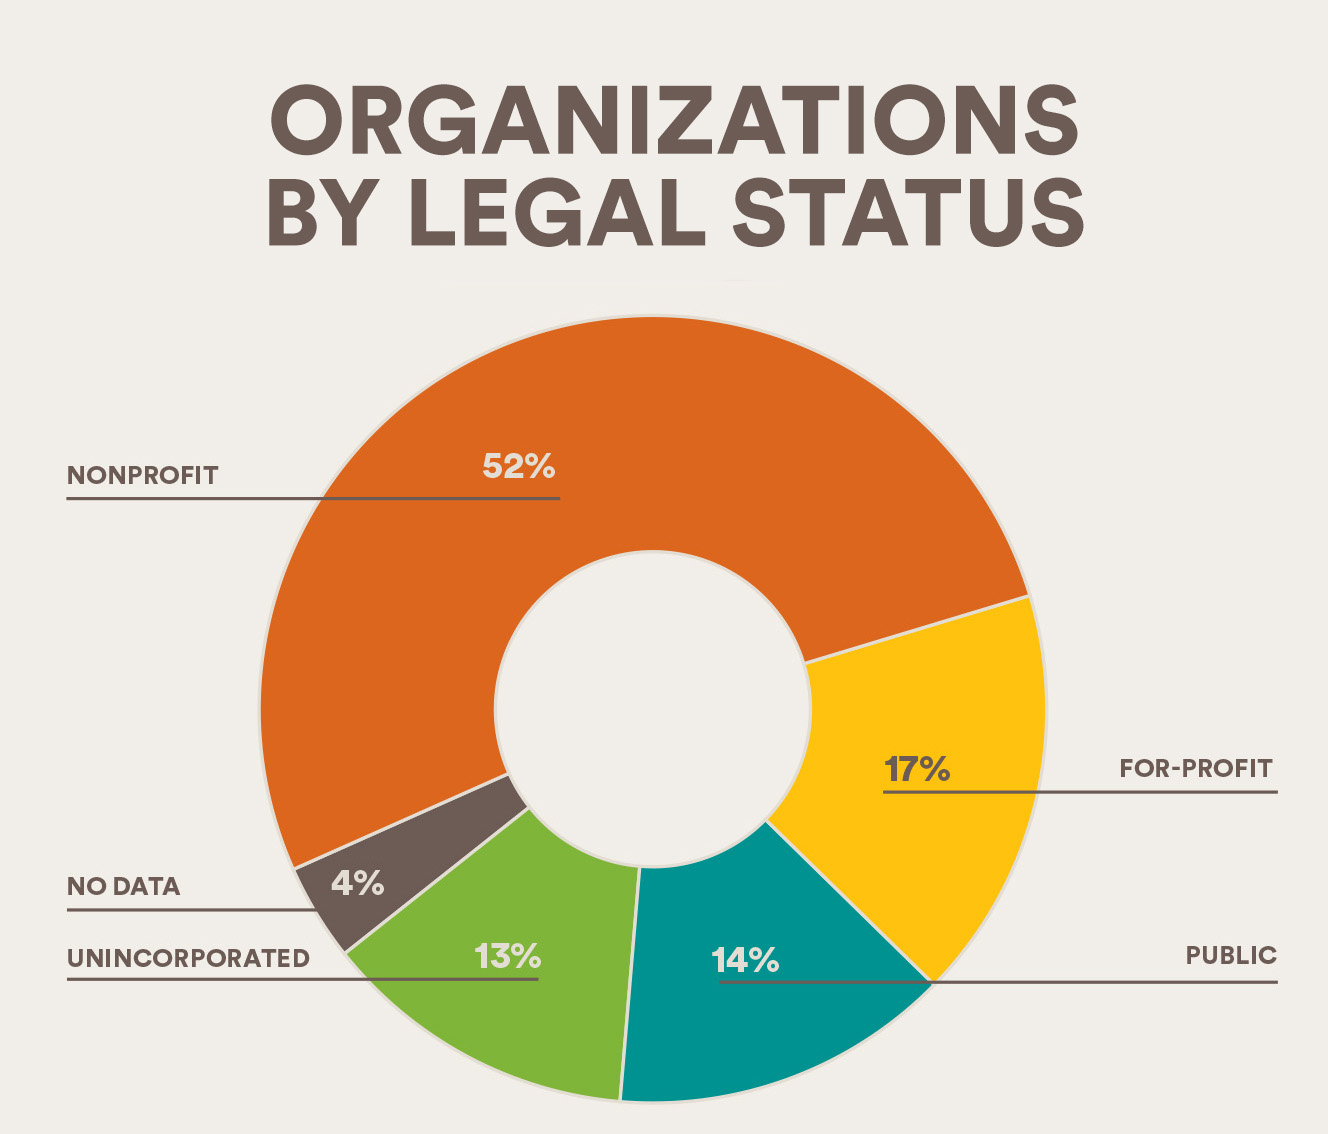
CHART 1, TABLE 2. This chart and table give the percent/number of organizations and programs by legal status.
Legal Status Observations:
- Nonprofits only make up about half of the cultural sector.
- While 7,894 are included in the nonprofit category, there is only 990 data for 4,293 organizations which means many organizations are only incorporated as nonprofits at the state level and/or they may have miscategorized themselves.
- Combined, for-profits, public entities, and unincorporated entities make up a significant portion of the sector.
- We have likely undercounted the for-profit entities. Additional work would be required to get a fuller picture of their number and geographic distribution.
Organization Size
While we do not have financial data on all the organizations, we can get some information from the Nonprofit 990 data. Out of the 4,293 organizations with 990 data:
- 2,479 file a 9900N which means their annual gross receipts are normally $50,000 or less.
- 1,534 file a 990 or 990EZ which means for the majority of those organizations their annual gross receipts normally exceed $50,000.
- 280 are not required to file so we have no insight on their annual gross receipts.
This means 58% of the Massachusetts cultural nonprofits registered with the IRS have budgets that fall below $50,000 a year.
Employees at Organizations
While it was not possible in the scope of this inventory to get employee data from all 15,063 organizations, we were able to look at data and related statistics on Massachusetts tax exempt cultural organizations filing the full 990 form with the IRS for 2023. Out of the 4,293 organizations with 990 data, 973 organizations provide employee data through the 990 Full Form.
These 973 organizations:
- Employ 24,894 people.
- Contribute $929,450,618 to the economy through salaries, compensation, and employee benefits.
- Leverage the human capital of 60,387 volunteers.
The 973 organizations are distributed across the state. However, in terms of the percent of workforce, organizations in Suffolk County account for almost half of all paid staff (48%). While Suffolk County also accounts for the largest portion of volunteers (29%) Middlesex and Hampshire Counties also have significant percentages of the total volunteers (24% and 13% respectively).
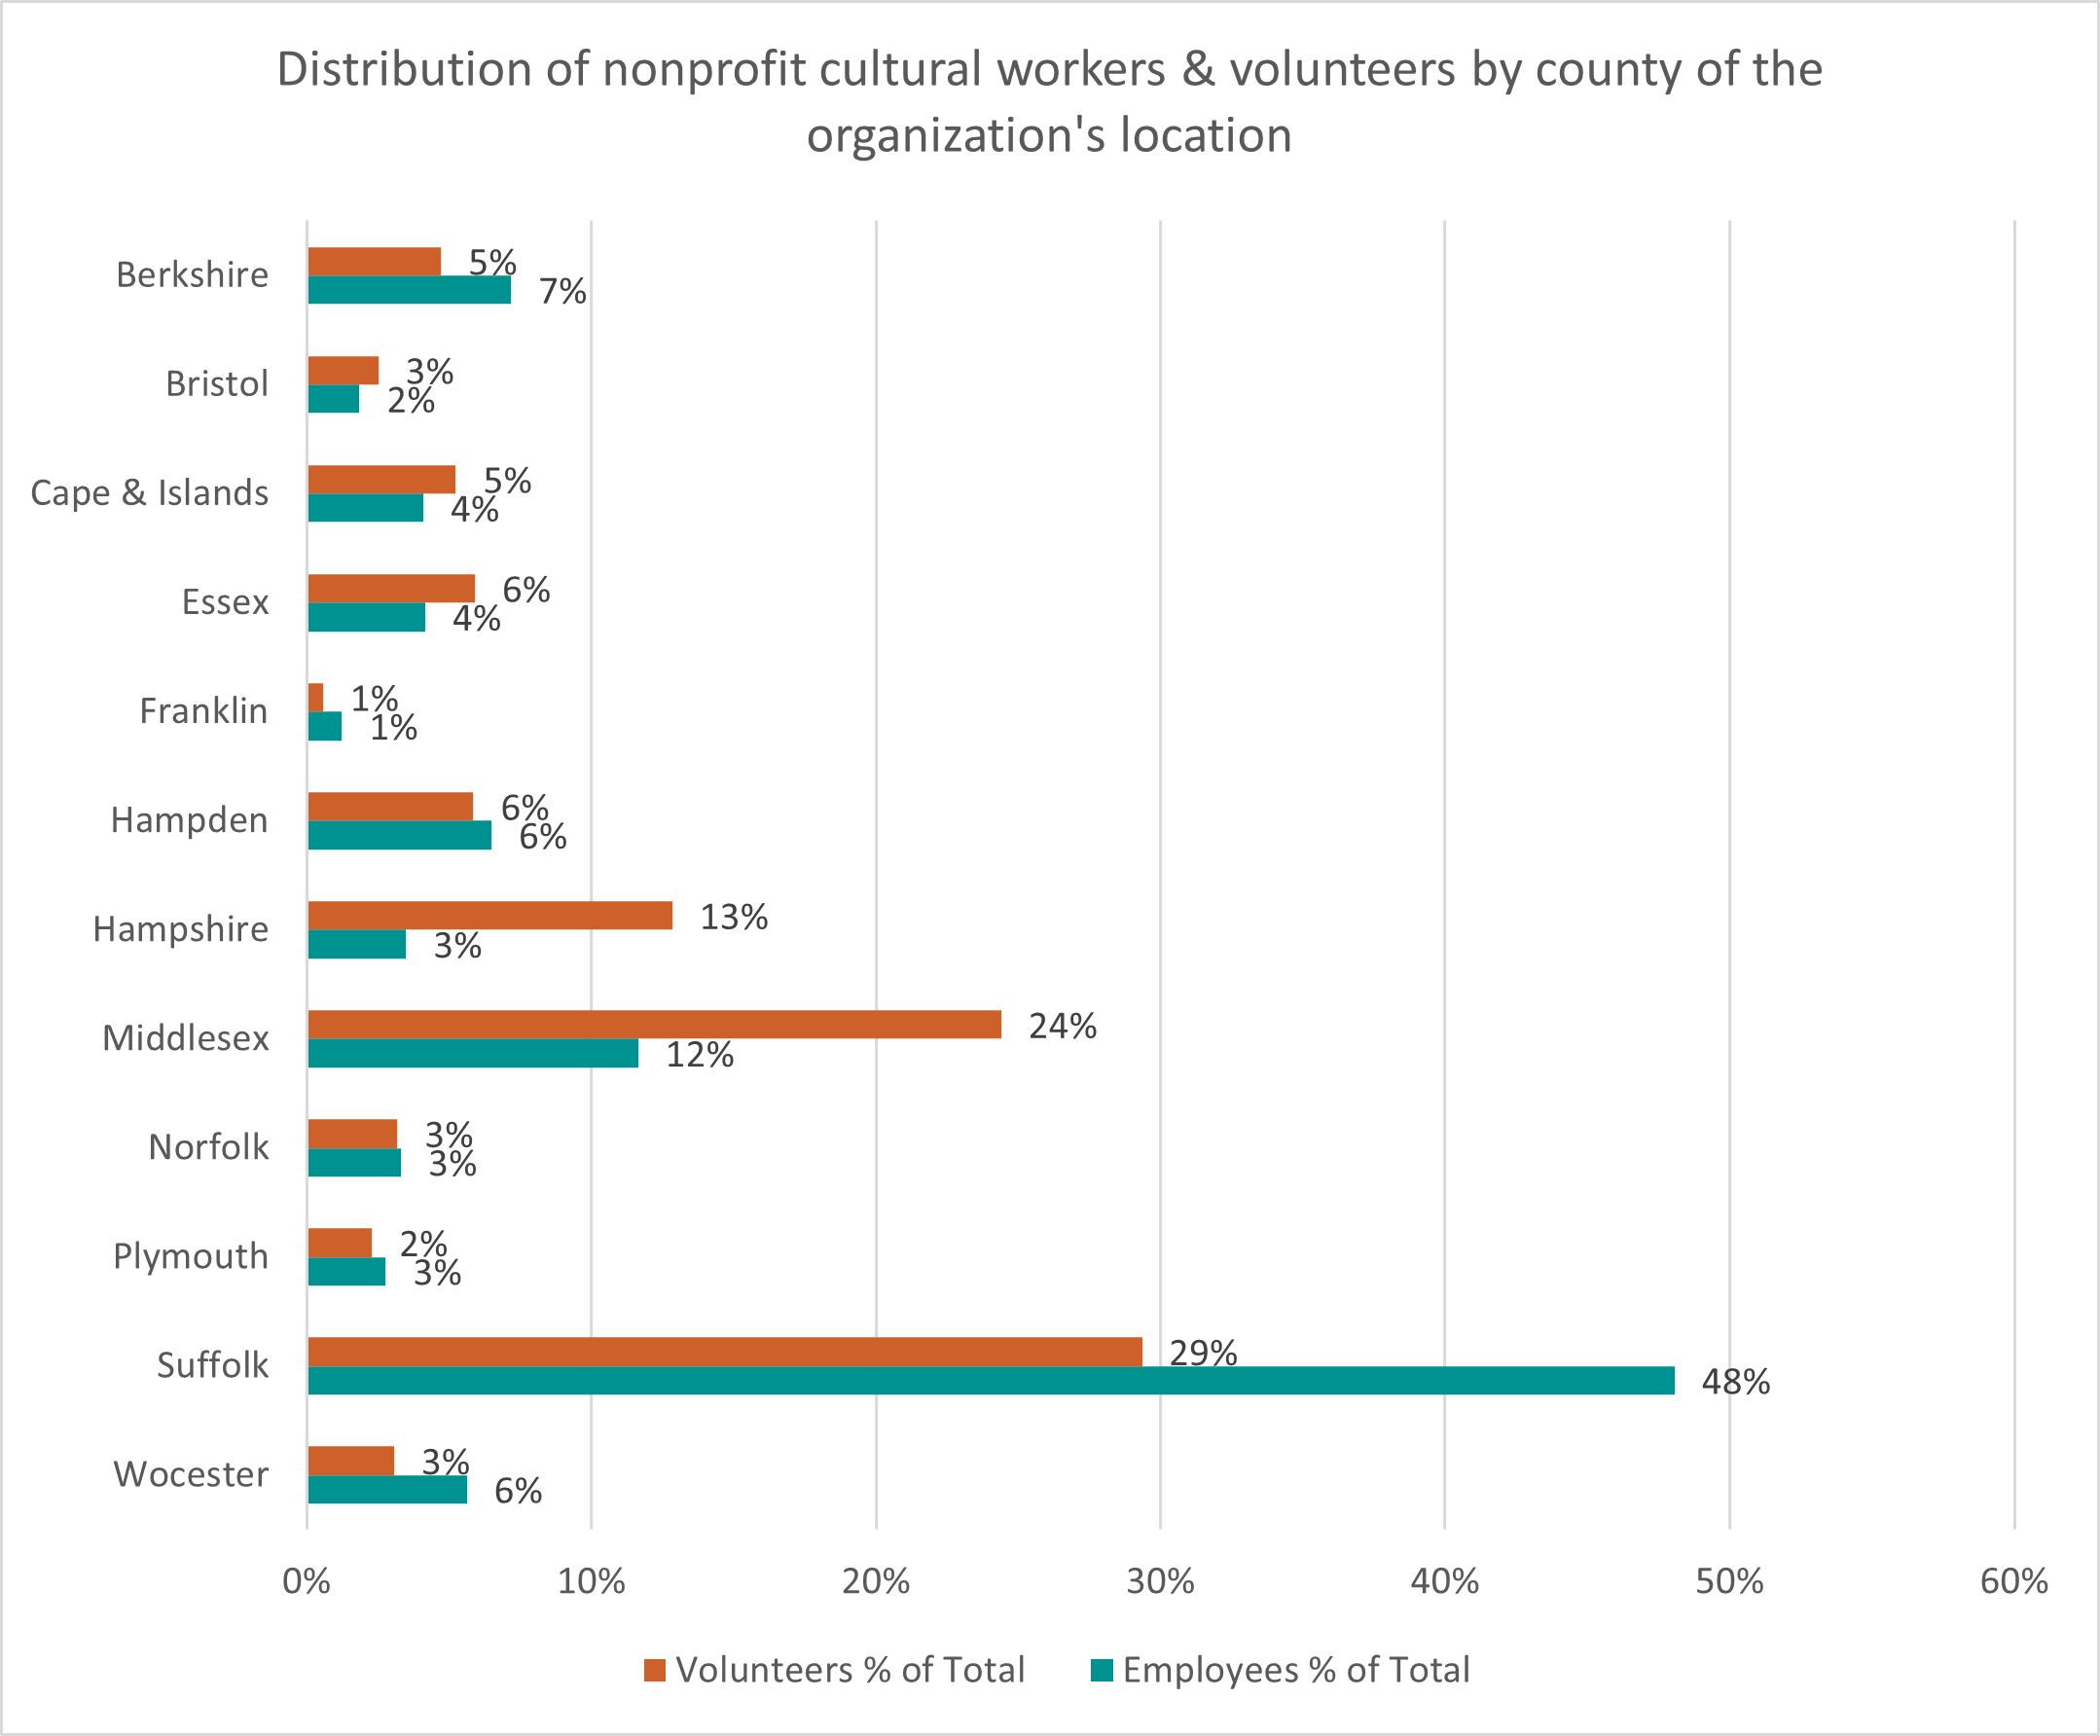
Chart 2. This chart shows the relative distribution of paid staff and volunteers by the county of the organizations they work with.
The largest 150 organizations by employee count represent ~15% of total Full 990s. These 150 organizations represent:
- 80% of W2 employees
- 82% of compensation, benefits, etc.
- 82% of gross receipts
- 58% of volunteers
For full details and additional information regarding these non-profit cultural workers, see slides 33-41 of the Diversity North Group final report (PDF).
Our Impact & Reach
Grantmaking
Over FY22, FY23, & FY24 our Agency and the Local Cultural Councils (LCC) have funded 5,500 organizations (37% of the 15,063 potential).
However, this includes the one-time pandemic funds in FY23. LCC funding also includes any locally raised funds they have.
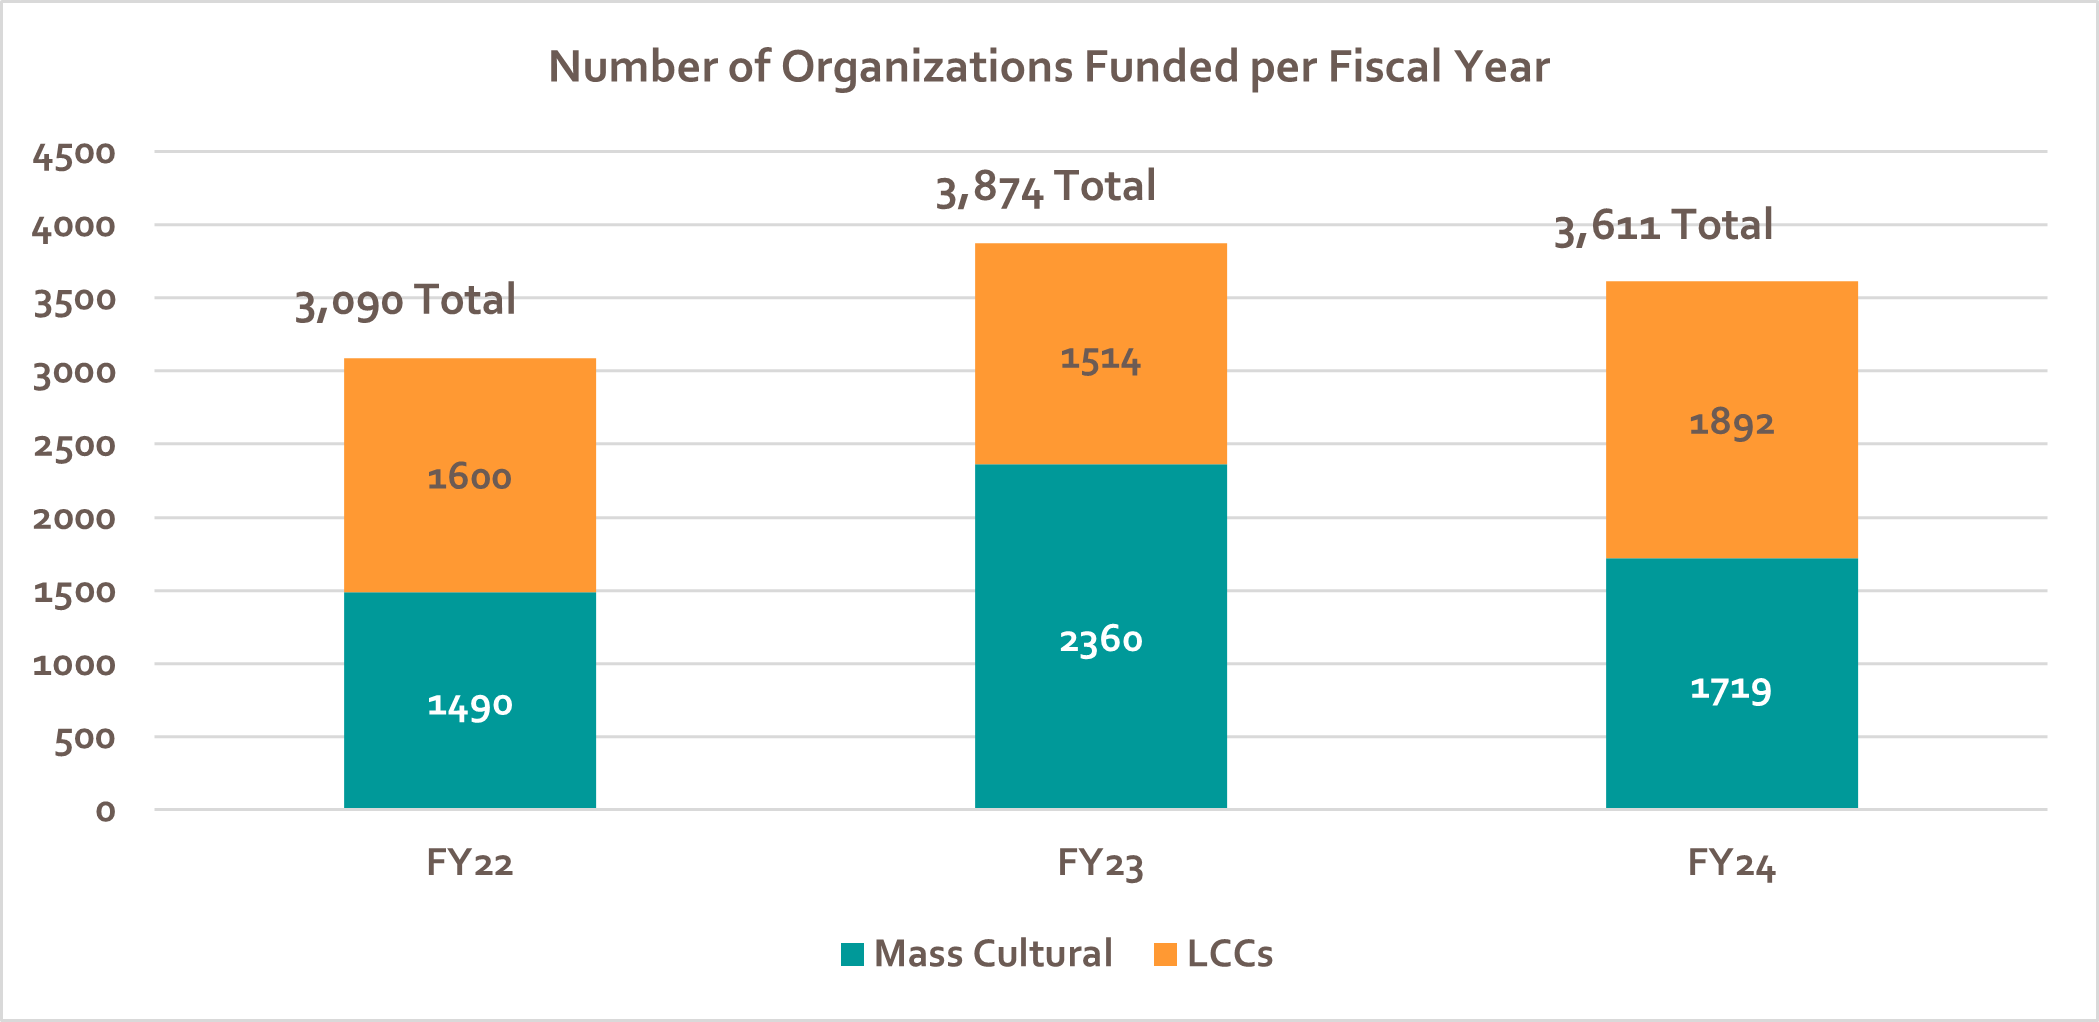
CHART 3. This chart and table give the number of unique organizations and programs that received funding from Mass Cultural Council or a Local Cultural Council.
Looking at legal status, the percentage of non-profit grantees largely aligns with the sector. However, the percent distribution of grants to public entities (state, municipal, and tribal governments) is larger for the agency’s funded organizations compared to the cultural asset inventory organizations.
|
Legal Status |
% of Total Asset Inventory Organizations (15K) |
% of Total Mass Cultural and LCC-Funded Organizations (5.5K) |
|
Nonprofit |
52% |
55% |
|
For-Profit |
17% |
5% |
|
Public |
14% |
31% |
|
Unincorporated |
13% |
9% |
|
No Data |
4% |
0% |
TABLE 3. This table compares the legal status of organizations in the inventory to the legal status of organizations funded by Mass Cultural Council and/or Local Cultural Councils between FY22 and FY24.
Our FY22 – FY24 direct grantmaking to organizations largely aligns with the geographic data. The following data reflects the number of grants the Mass Cultural Council made to organizations. It does not include grants made by Local Cultural Councils.
Middlesex has the lowest proportional representation (-3.27%) and Berkshire has the highest (2.77%).
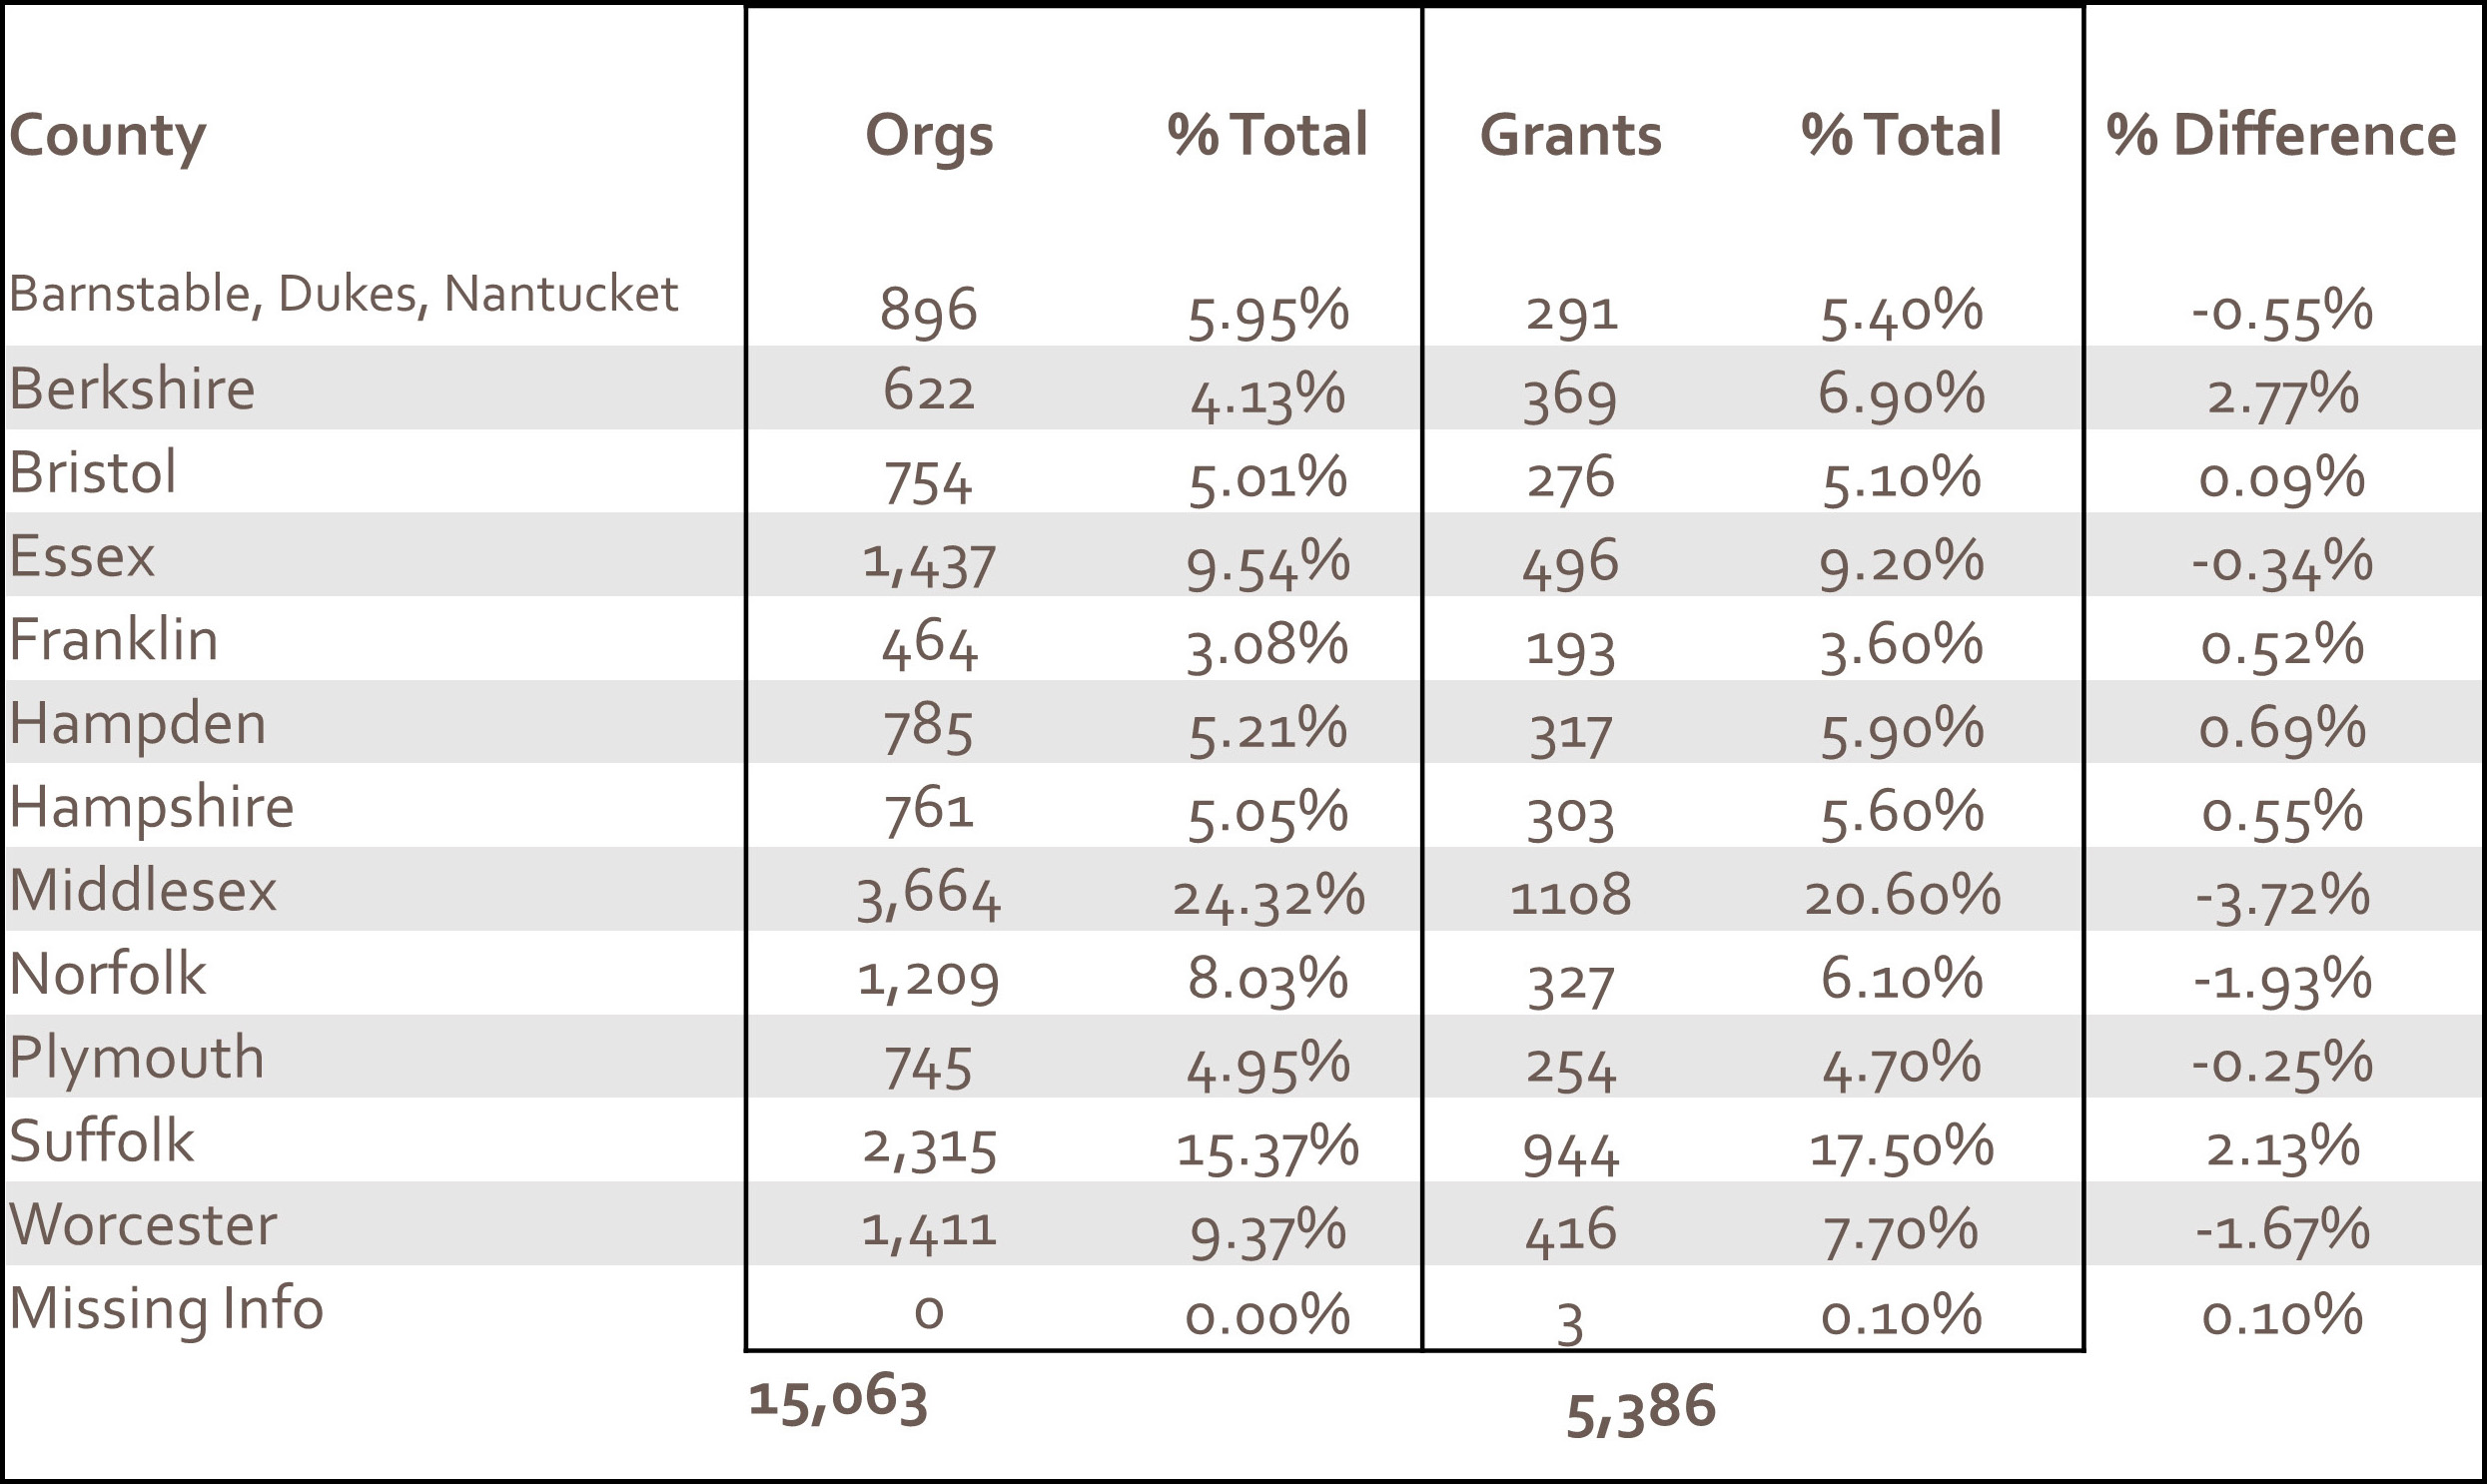
TABLE 4. This table compares the number of organizations and Mass Cultural Council grants to organizations by county.
Mass Cultural Council Next Steps
- Verify, reconcile, and augment Cultural Assets Inventory organization & program information (including contact information) across all included entries (still varied by source).
- Coordinate outreach to organizations to get them into CreativeGround.org.
- The Cultural Assets Inventory serves to enrich the listings in CreativeGround, which continues to serve as the publicly available inventory of Massachusetts cultural organizations & programs thereby providing one repository for all data.
- Integrate this inventory into Mass Cultural Council’s grants management system.
Individuals
Methodology
Data Source: American Community Survey (ACS)
Included in this study:
Individuals working professionally as GENERATORS of Arts, Humanities, and Interpretive Science who make more than 50% of their income from their Arts, Humanities, Science occupation.
Not included in this study:
- Individual professional GENERATORS working part-time with another leading occupation, or working unpaid
- Individuals working in the 15,063 cultural institutions who are not GENERATORS (e.g., administrators, front of house staff, etc.)
- Teachers at all levels (k-12 through college/university) in these domains (e.g., music teachers, band directors, collegiate art professors, etc.)
Why did we use the ACS data?
Because the data of the ACS is extraordinarily reliable and is the ONLY source providing robust demographic description variables at the individual level.
The ACS classifies a person’s occupation based on where they earn the most income. This means only those whose primary income comes from one of the 36 arts, humanities, or interpretive science occupations we identified are included in our study. For example, if someone is both a dancer and a physical therapist but earns more as a therapist, they are excluded. This may result in an undercount, particularly for those with multiple occupations.
Therefore, we know this inventory has an undercount of Generators because many Generators may make less than 50% of their income from their arts, science, or humanities occupation.
The survey population includes:
- All U.S. citizens and non-citizens.
- All people in the 50 states, the District of Columbia, and Puerto Rico.
In terms of the occupation statistics of this Mass Cultural Council study:
- People included are over 18 years old, not in school, and identify themselves with an occupation.
- People name their own occupation.
- If someone has multiple occupations, their primary job is assigned based on where they earn the most income. If they are unsure, they report the job where they spend the most time.
- Unemployed people are asked to identify their most recent occupation.
Data for these Mass Cultural Council statistics:
- Reflects data collected over the 5-year period (2018-2022) or in the case of county-based statistics, the latter 4 years (as data collection rules changed).
For full details and additional information regarding methodology, see slides 43-49 of the Diversity North Group final report (PDF).
Arts, Humanities, Interpretive Science Occupations
To analyze occupations, Mass Cultural Council identified a core set related to the arts, sciences, and humanities, acknowledging that categorization is imperfect and ever-evolving.
- Begin with job title classification scheme, “Standard Occupational Classification” or SOC codes of the U.S. Department of Labor Statistics/U.S. Census.
- Included all National Endowment for the Arts job titles.
- Included job classifications already supported by Mass Cultural Council.
- Mass Cultural Council surveyed its Inventory Working Group to distinguish GENERATORS—those creating art, humanities, or interpretive sciences—from cultural workers employed in cultural organizations. For example, a museum security chief is a cultural worker, not a GENERATOR.
- Discussion of the Mass Cultural Council Inventory Working Group on survey results.
- Further internal dialogue.
- Decision.
Some creative Generators work in mixed occupations where not all practitioners are artists, such as bakers, chefs, and hair or nail artists. While they use creativity as a tool, our analysis focuses on occupations where most workers are Generators to provide a clearer picture of their economic and demographic realities.
The data on Generators was focused on two main areas:
- Individual Generator Statistics
- Individual Generator Income Statistics
Individual Generator Statistics
Occupations (36) and Estimated Count
- Other designers (product, user interface, packaging, etc.): 11,030
- Graphic designers: 9,270
- Artists & related workers: 8,930
- Writers & authors: 8,650
- Architects, except landscape & naval: 8,630
- Librarians & media collections specialists: 7,130
- Editors: 6,340
- Musicians & singers: 5,040
- Photographers: 4,790
- Producers & directors: 4,670
- Interior designers: 3,800
- Technical writers: 3,020
- Printing press operators: 3,010
- Interpreters & translators: 2,970
- Archivists, curators, & museum technicians: 2,840
- News analysts, reporters, & journalists: 2,420
- Floral designers: 2,190
- Web & digital interface designers: 2,060
- Television, video, & film camera operators & editors: 1,840
- Tailors, dressmakers, and sewers: 1,650
- Jewelers & precious stone & metal workers: 1,650
- Actors: 1,410
- Landscape architects: 1,360
- Music directors and composers: 1,230
- Entertainers and performers, sports & related workers, all other: 1,160
- Photographic process workers & processing machine operators: 780
- Commercial and industrial designers: 650
- Merchandise displayers & window trimmers: 650
- Library technicians: 620
- Manufacturing: stone cutters/carvers, glass blowers, potters: 580
- Print binding & finishing workers: 420
- Dancers and choreographers: 400
- Broadcast announcers & radio disc jockeys: 370
- Disc jockeys, except radio: 230
- Etchers & engravers: 230
- Fashion designers: 180
In total there are an estimated 112,190 people in 36 occupations. This represents 3% of Massachusetts’ workforce. This puts these occupations on par with the 116,937 Massachusetts biopharma employees reported in 2023.
The top 10 Generator occupations by count represent 66% of the Massachusetts Generator population.
Massachusetts Generators Compared to Massachusetts Workforce
Compared to the general workforce in Massachusetts, Massachusetts Generators are:
- More than half women (55%)
- Less racially diverse: 82% white vs 72% white in the general workforce.
- More highly educated (4-year college and graduate degree)
- Fewer immigrants: 16% vs 22% in general workforce
- More frequently speak English at home: 83% vs 76% in general workforce
- Same frequency of difficulties/disabilities*: 8%
*Difficulties = any or all of: cognitive, ambulatory, can’t live independently, can’t self care, serious vision difficulty interfering with work, serious hearing difficulty interfering with work as defined by U.S. Census.
Massachusetts Generators Compared to U.S. Generators
Compared to all U.S. Generators, Massachusetts Generators track U.S. Generators generally, but are noticeably more highly educated, have higher individual and household incomes, and are more likely to have Medicaid coverage.
The age of Massachusetts Generators is fairly similar to U.S. generators across demographic categories of interest except that BIPOC participants are younger by 5-9 years, on average, and people with” difficulties” are older, by 5-10 years, across quartiles.
You can review the MA and U.S. comparison data on slides 51-54 of the Diversity North Group final report (PDF).
Demographic Data
The demographics of Massachusetts Generators varies by occupation. For example, looking at the top 10 occupations by count:
- There is remarkable occupational segregation of women across Generator occupations from a high of 84% female in Librarians to a low of 33% women in Architects.
- There is remarkable occupational segregation of BIPOC across Generator occupations from a low of 9% Librarians and Producers/ Directors to a high of 20% in all Other Designers.
You can review the MA and U.S. comparison data on slides 55-60 of the Diversity North Group final report (PDF).
Income Data
Income among Generators varies widely. Most earn on the lower end, while a small number make millions, creating a big gap between the majority and the highest earners. This results in the following:
The median individual income within the 36 Generator occupations varies from $7,074 for Dancers and Choreographers to $88,684 for Architects.
- Most Generators in Massachusetts earn far less than the state’s living wage of $58,011 (as of December 2024), and many households they live in also fall below this threshold.
- Meanwhile, top earners make up to 23 times the median individual income and 93 times the median household income, highlighting a major income gap.
- For many Generators, household income helps make up for low individual earnings.
|
Income Groups |
Mean |
Median (50th Percentile |
99th Percentile |
Max |
|
Individual Income Total |
$62,033 |
$49,182 |
$353,000 |
$1,127,332 |
|
Family in Household Income Total |
$155,409 |
$110,694 |
$719,961 |
$10,306,650 |
Table 5. MA GENERATORS total individual and family in household income. Source Data: American Community Survey (2018-2022) as of December 2024.
Only 8 out of 36 occupations have a median individual income higher than the MA Living Wage for 1 adult, no children.
- Massachusetts Living Wage 1 adult, no children: $58,011 as of December 2024 (Source: MIT Living Wage Calculator)
A few high earners push up the average, but most Generators make much less. This means the average income doesn’t reflect how many people are actually earning low wages.
You can review more income data on slides 62-67 of the Diversity North Group final report (PDF).
Income Sources and Stability/Instability
More than 70% of Generators receive wages from an organization (i.e., they are employees). About 25% have self-employment (business) income. They can have more than one source of income, so some have both as well as other income sources.
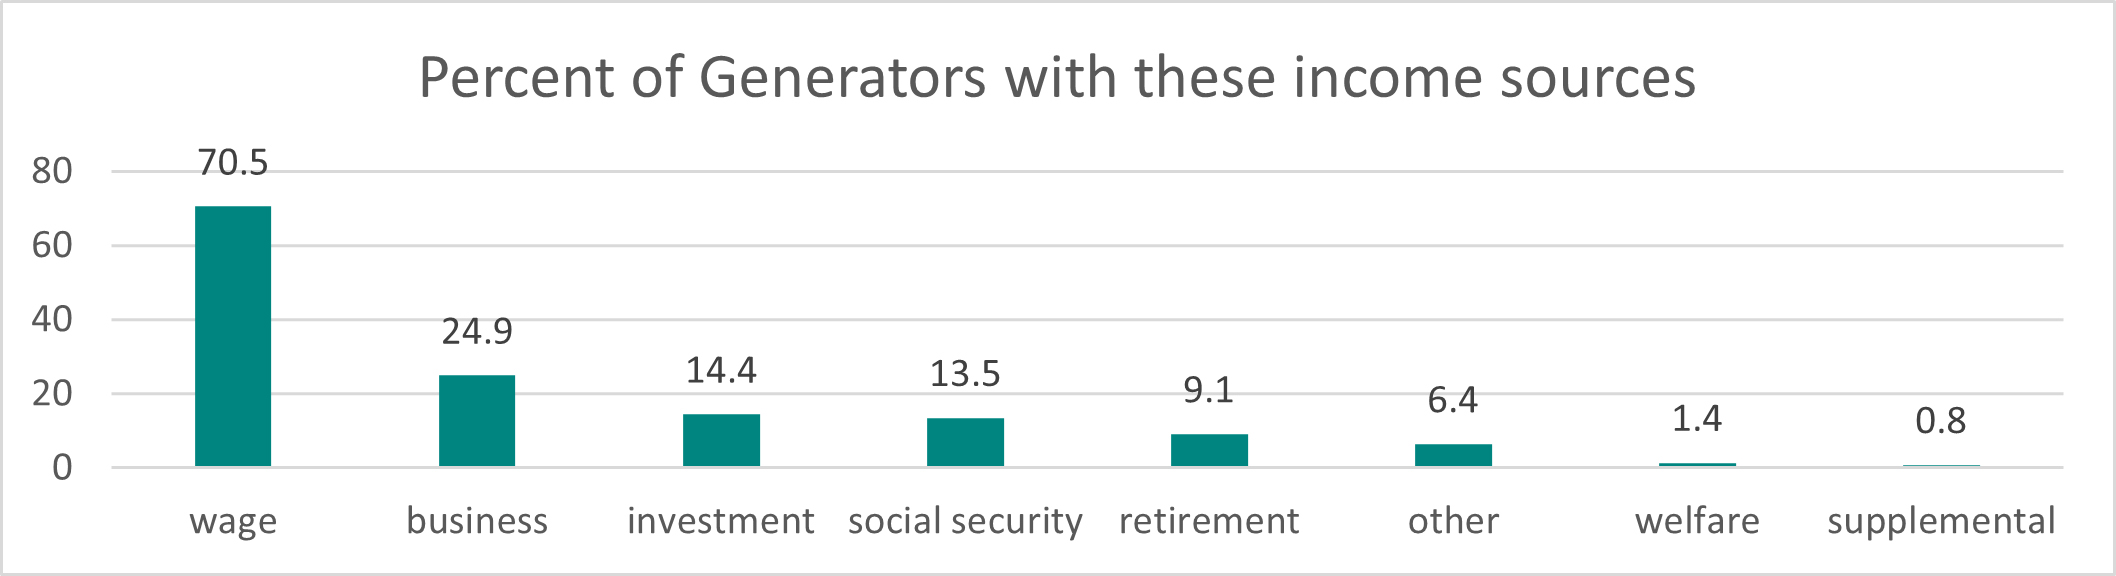
Chart 4. Chart of percentages of Generators with certain kinds of income sources.
Comparing wage and business income, there are 7 occupations that rely more heavily on business income. One third or more of their income comes from business income, meaning it is self-generated, and these workers are more frequently contractors/gig workers:
- Dancers and choreographers: 55%
- Artists and related workers: 53%
- Photographers: 49%
- Jewelers and precious stone and metal workers: 47%
- Musicians and singers: 41%
- Entertainers and performers, sports and related workers, all others: 39%
- Writers and authors: 34%
Given that these occupations have less wage income, they would have less access to the stability that employment-based income offers – predictability, other benefits, insurance, etc.
The ten occupations with the lowest median income of the 36 identified have incomes between $7,074 and $28,800. There are 4 occupations with higher reliance on business/self-generated income that are also one of the 10 lowest median income occupations:
- Dancers and choreographers: $7,074 median income
- Entertainers and performers, sports and related workers, all other: $23,875 median income
- Photographers: $25,767 median income
- Musicians and singers: $28,000 median income
In a sector where occupations are already largely below the living wage in the state, and there is a lot of income variability these occupations may face the most instability as a group.
You can review more income source and variability data on slides 67-69 of the Diversity North Group final report (PDF).
Income Inequity
Despite diversity, equity, and inclusion efforts and initiatives aimed at closing the gap, income inequity persists in the cultural sector for Generators. People who are Non-POC, Male, Speaking English at Home, and with No Defined Difficulties make higher incomes at all percentile levels than their comparisons.
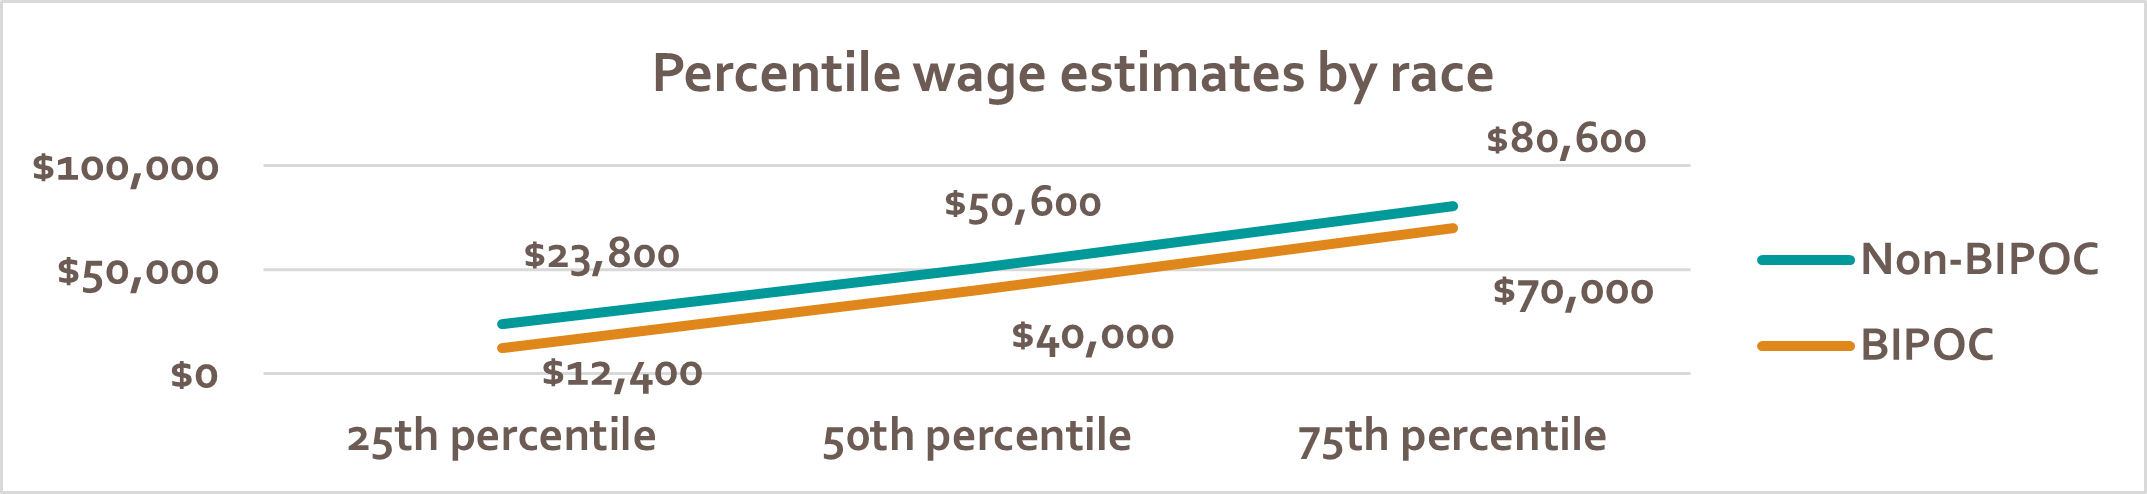
Chart 5. Chart of Generator income differences by race.
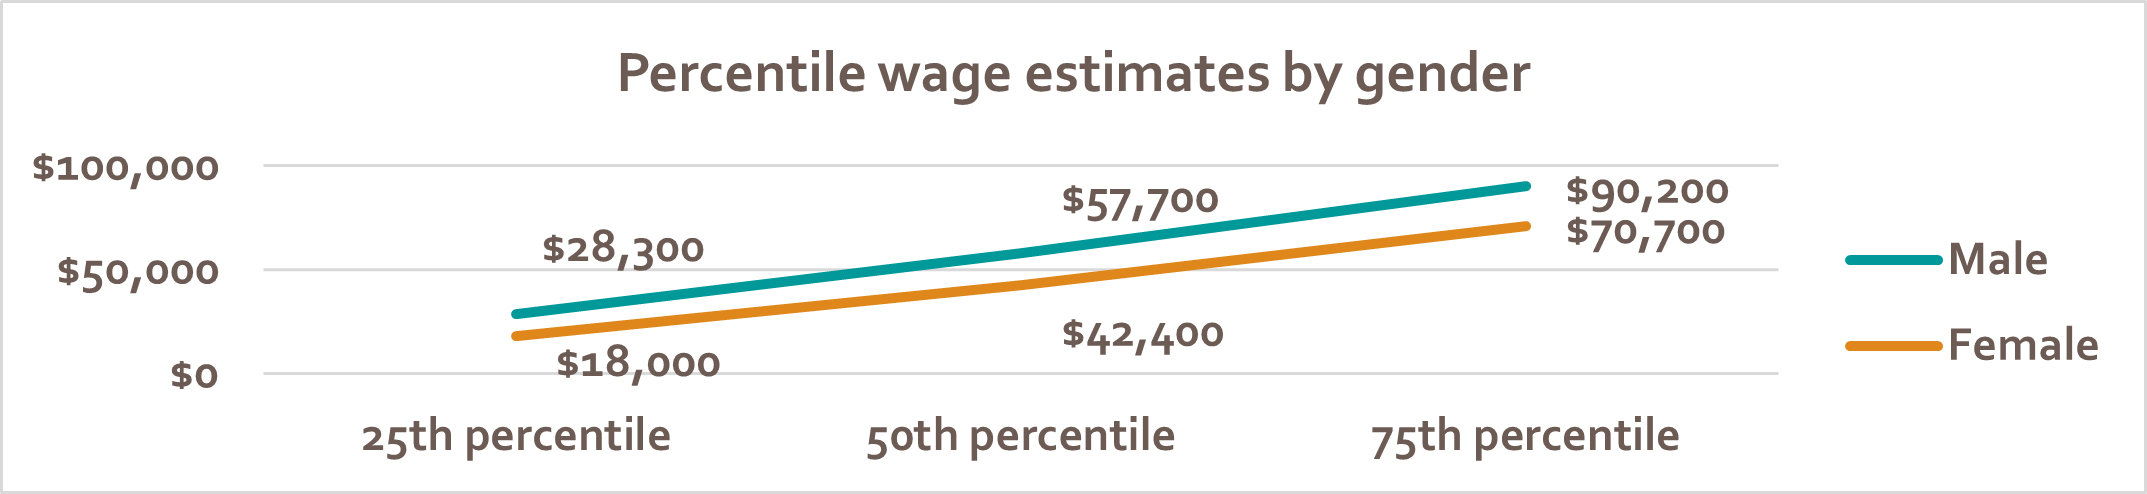
Chart 6. Chart of Generator income differences by gender.
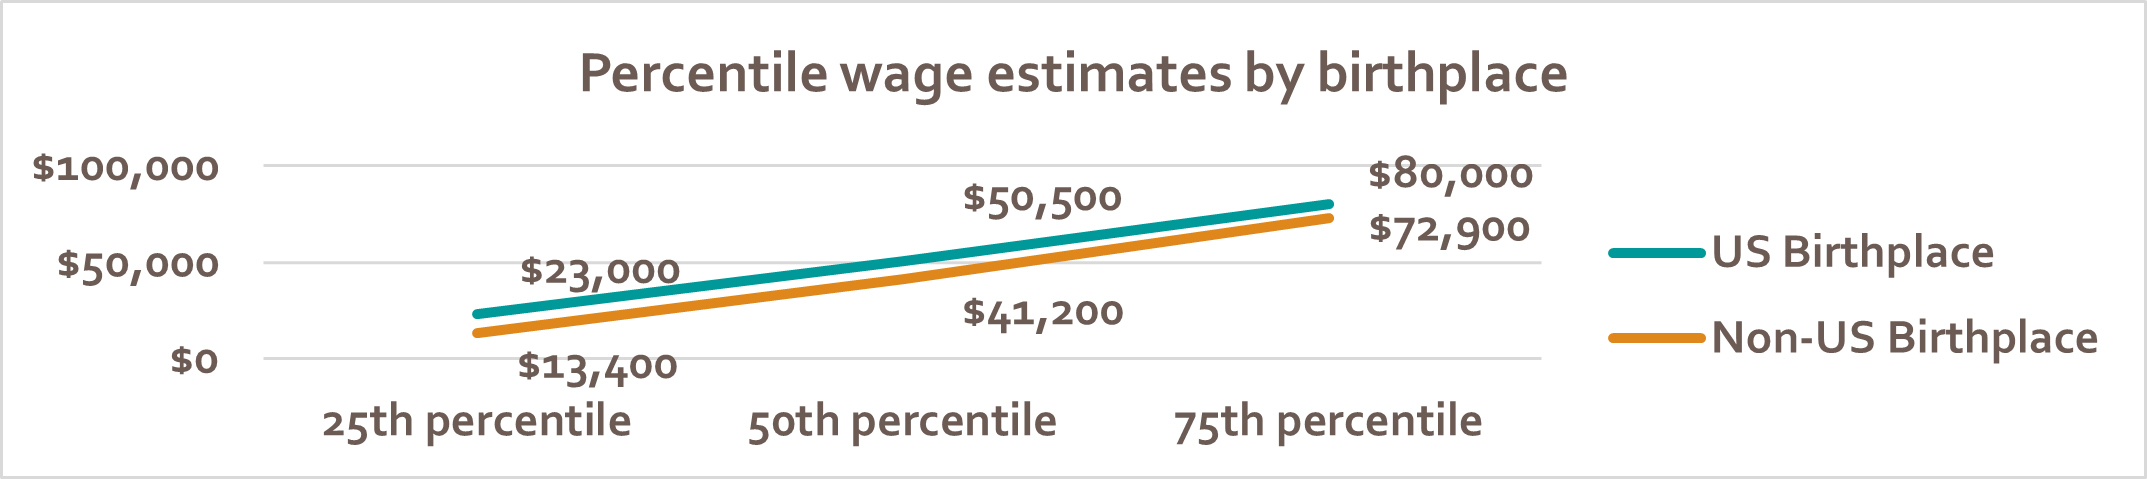
Chart 7. Chart of Generator income differences by birthplace.
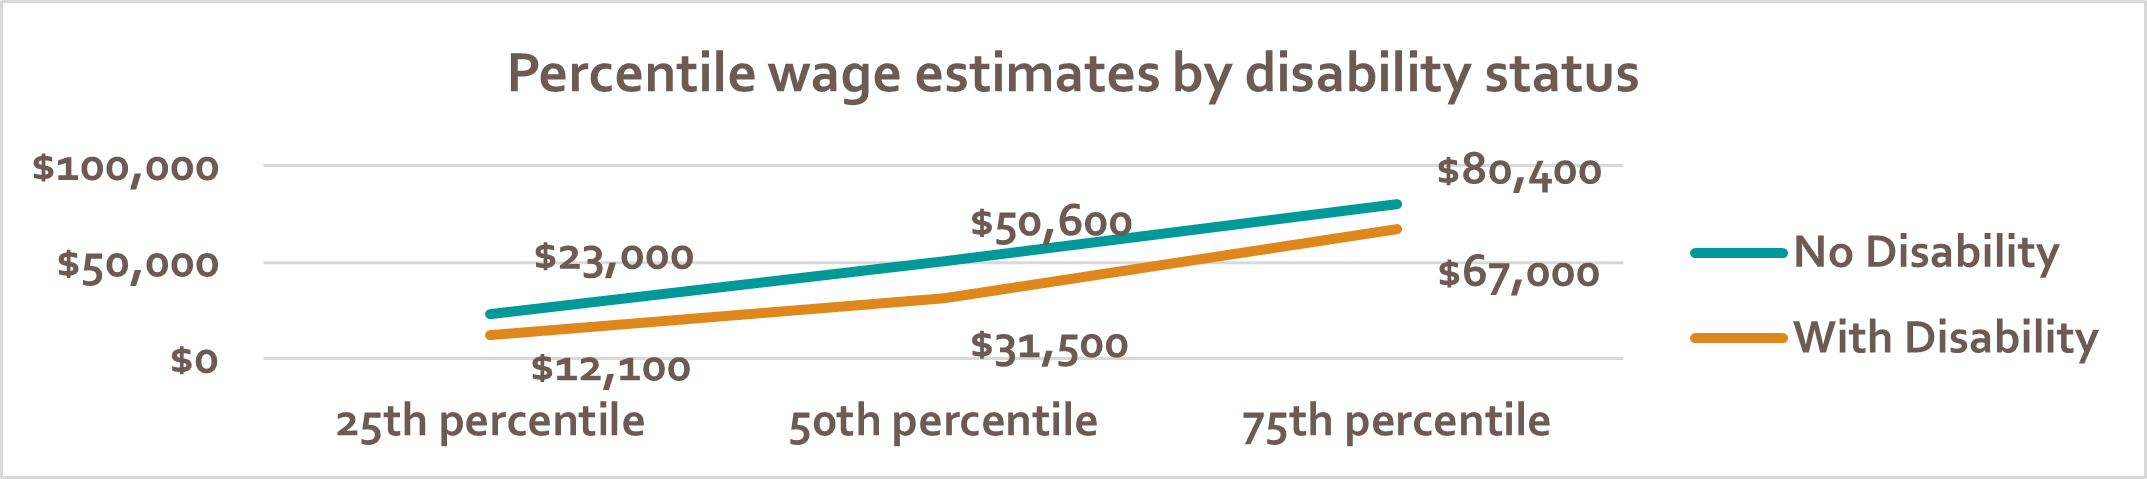
Chart 8. Chart of Generator income differences by disability status.
You can review more income data related to equity on slides 70-77 of the Diversity North Group final report (PDF).
Our Impact & Reach
Grantmaking
Over FY22, FY23 & FY24 the Agency and Local Cultural Councils have funded 6,247 individuals (6% of the 112,000 potential).
However, this includes $20 million in one-time pandemic funds in FY23 which went to 4,000 people.
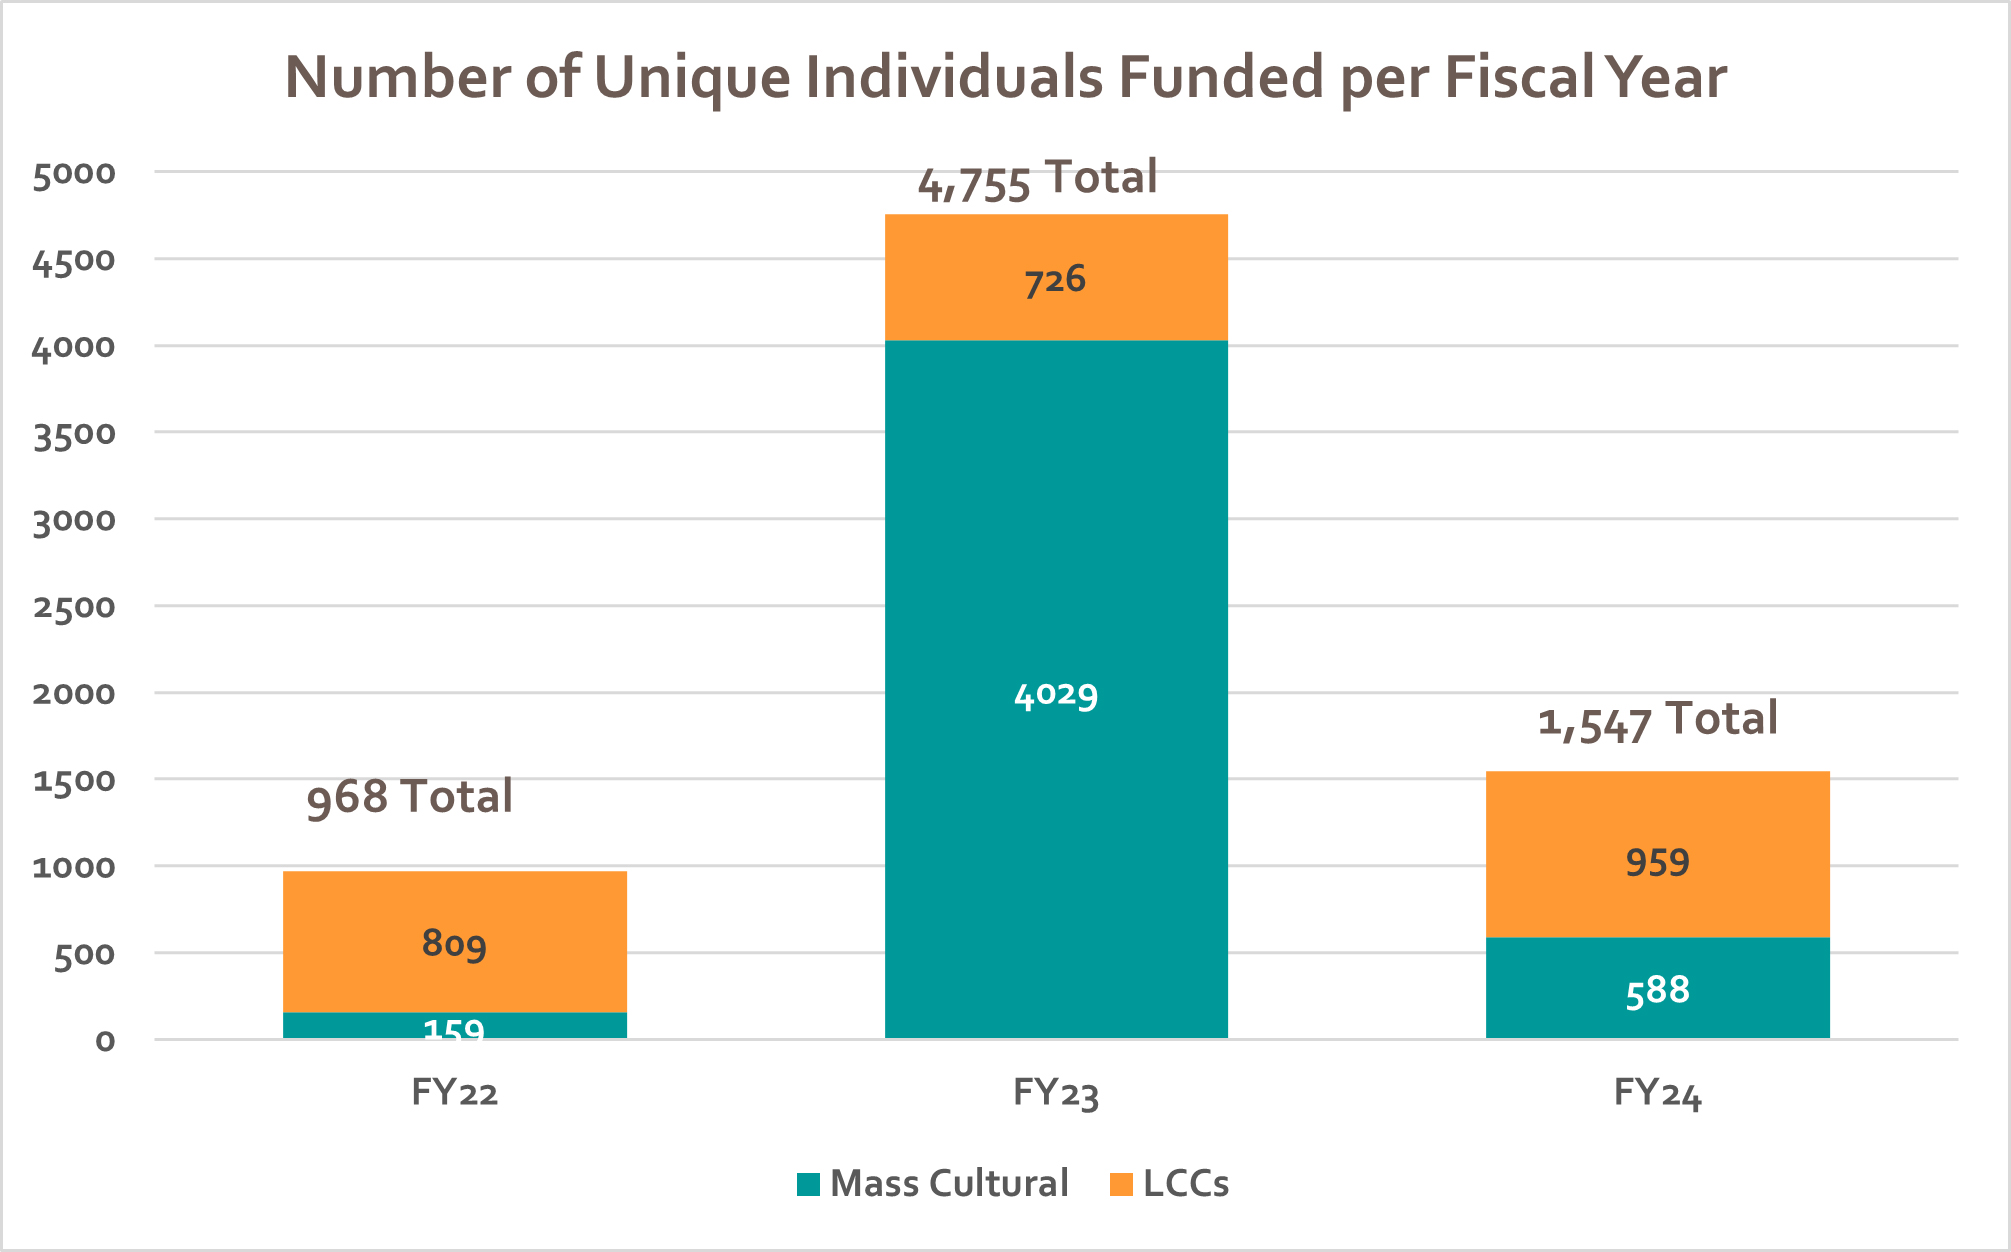
Chart 9. Chart of the number of unique individuals who received funding from Mass Cultural Council or a Local Cultural Council.
Conclusion
The cultural sector is a major economic driver for Massachusetts, yet this data makes one thing clear – it is critically under-resourced and undervalued for its crucial economic impact. While we remain committed to continuing advocacy for state funding for the sector, our grant funds alone are not a solution to the financial instability of the sector.
Mass Cultural Council is focused on forging new partnerships that unlock fees for service or contracts from other agencies, expanded funding sources, and integrating the arts into broader public and private economic and policy agendas – including the scaling of our arts-based social prescription work.
But we cannot do this alone.
Everyone who benefits from or works in the creative and cultural sector must engage in this adaptive work and mindset shift.
Mass Cultural Council’s general actions determined by this report are:
- Leverage resources and opportunities from other sectors/agencies
- Develop policy solutions to address sector needs
- Continue to advocate for increased funding
- Encourage the sector to more deeply engage in organizing and advocacy
- Encourage the sector to invest in deepening its entrepreneurial and innovative practices and skills
- Continue equitable distribution of our allocations and prioritizing funding for communities that lack access to capital.