Power of Culture Blog
State Funding for Arts & Culture Reaches Record High
An update on the FY27 state budget and capital spending plan
Dawn Heinen, Digital Communications Manager
The National Endowment for the Arts (NEA) has released new data showing arts and cultural industries hit an all-time high in 2022, contributing 4.3% of gross domestic product, or $1.1 trillion, to the U.S. economy. However, growth was not sector-wide, with performing arts organizations, non-government museums, and arts-related construction among the arts industries that have yet to reach their pre-pandemic levels of economic value.
These findings and more come from the Arts and Cultural Production Satellite Account (ACPSA), a product of the NEA and the U.S. Bureau of Economic Analysis that tracks the annual economic value of arts and cultural production from 35 industries—including both commercial and nonprofit entities. A national summary report and an accompanying interactive graphic is available, along with state-level estimates.
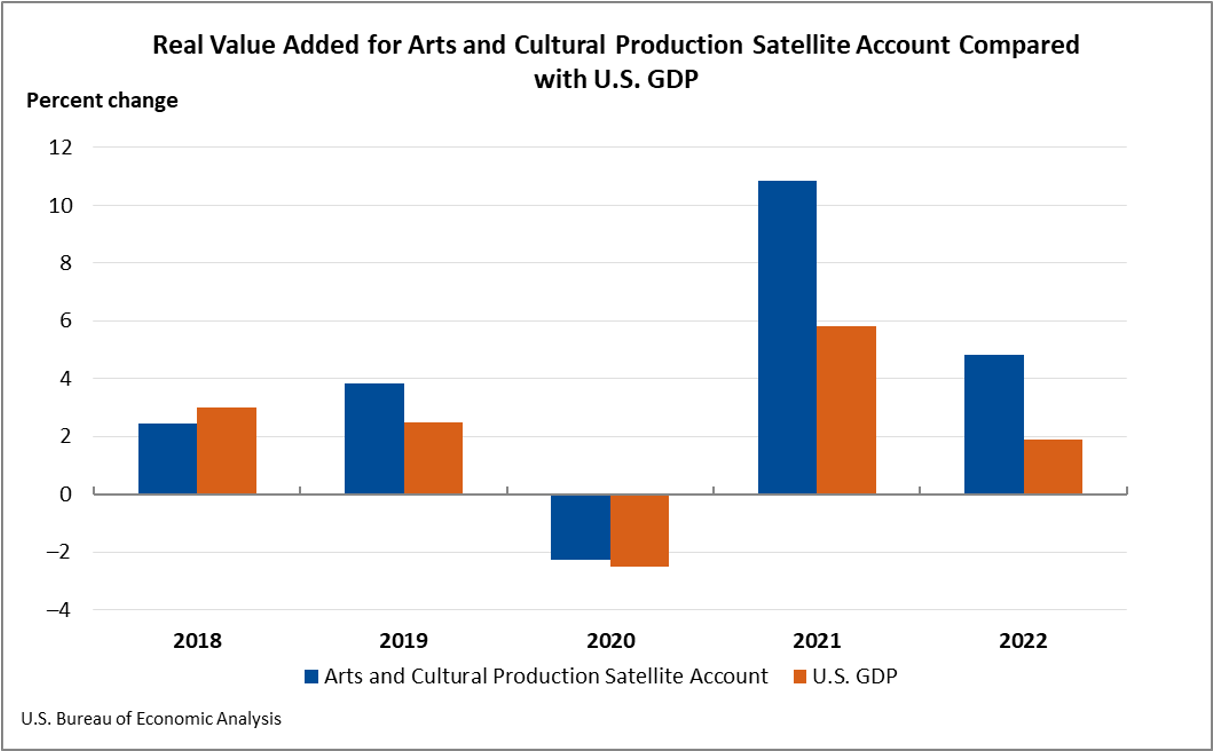
The overall arts economy grew by 4.8% in inflation-adjusted dollars between 2021 and 2022, a rate increase far surpassing that for the entire U.S. economy during the same time period. Since the pre-pandemic year of 2019, arts and cultural industries have surged by 13.6%. By contrast, the U.S. economy grew by 5.5% over the same period.
The value added by three industries—independent artists, writers, and performers; performing arts presenters; and agents/managers—have all outstripped 2019 levels. (For example, the value added by independent artists, writers, and performers has jumped by 13.5% since 2019, with 18.4% growth between 2021 and 2022.)
Performing arts organizations saw a steep decline in value added between 2020 and 2021. Between 2021 and 2022, however, the industry made a sharp comeback (an increase of 76.5%). Despite this rise, the value added by performing arts organizations is still below the pre-pandemic (2019) level. Note: the arts and cultural industries tracked in this account include both commercial and nonprofit entities.
In 2022, total arts and cultural employment recovered to pre-pandemic levels, with nearly 5.2 million workers employed to produce arts and cultural goods and services, for $540.9 billion in total compensation. (Note: ACPSA does not count self-employed artists and other cultural workers in its employment figures.)
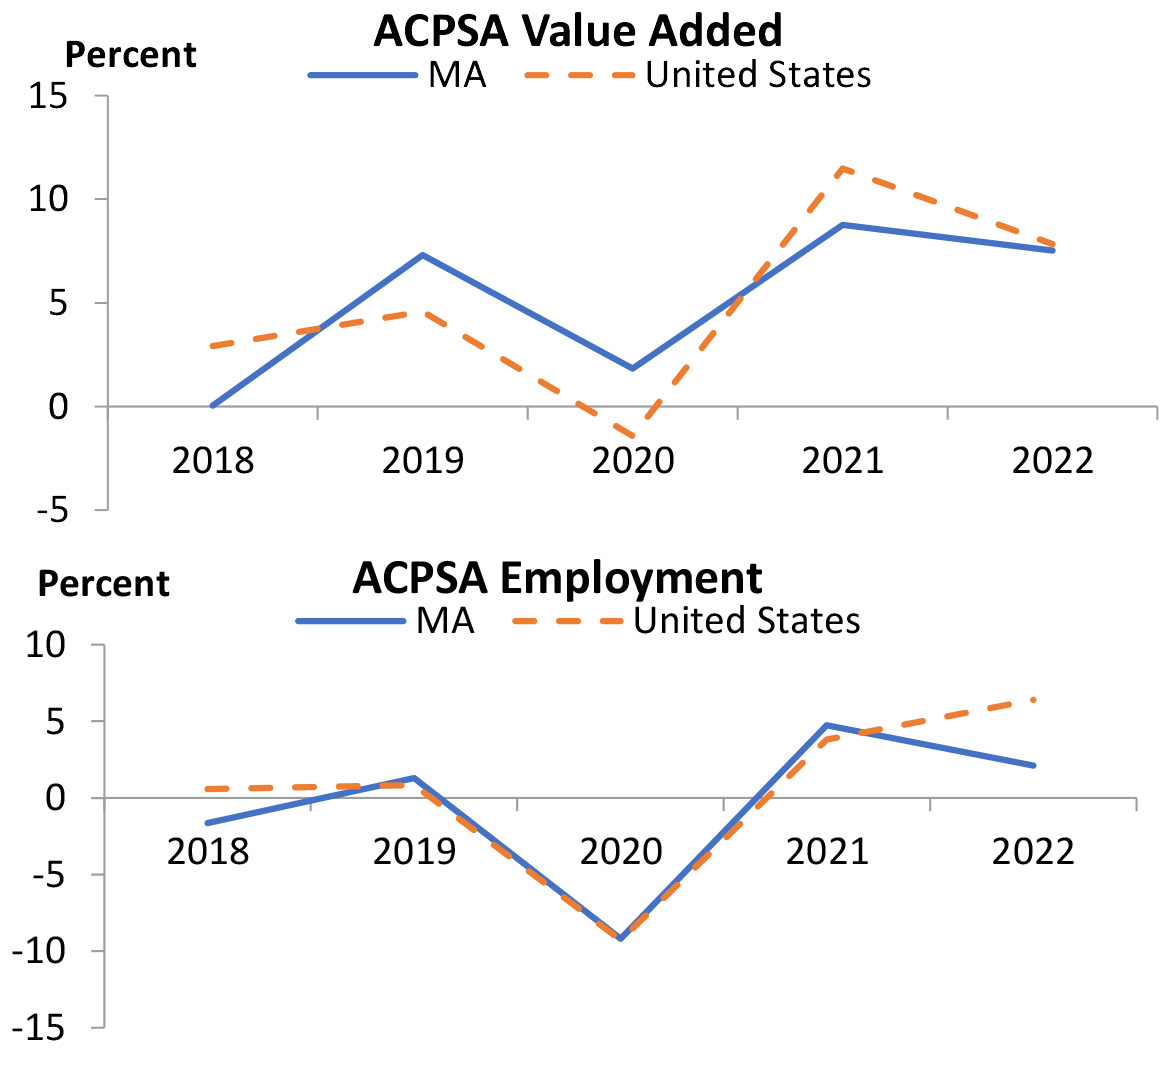
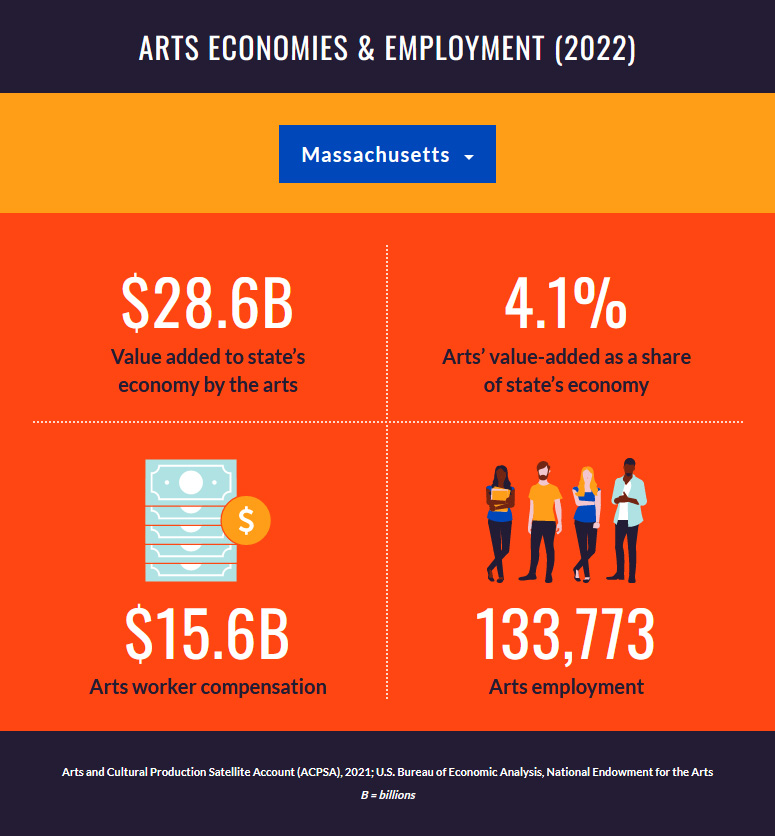
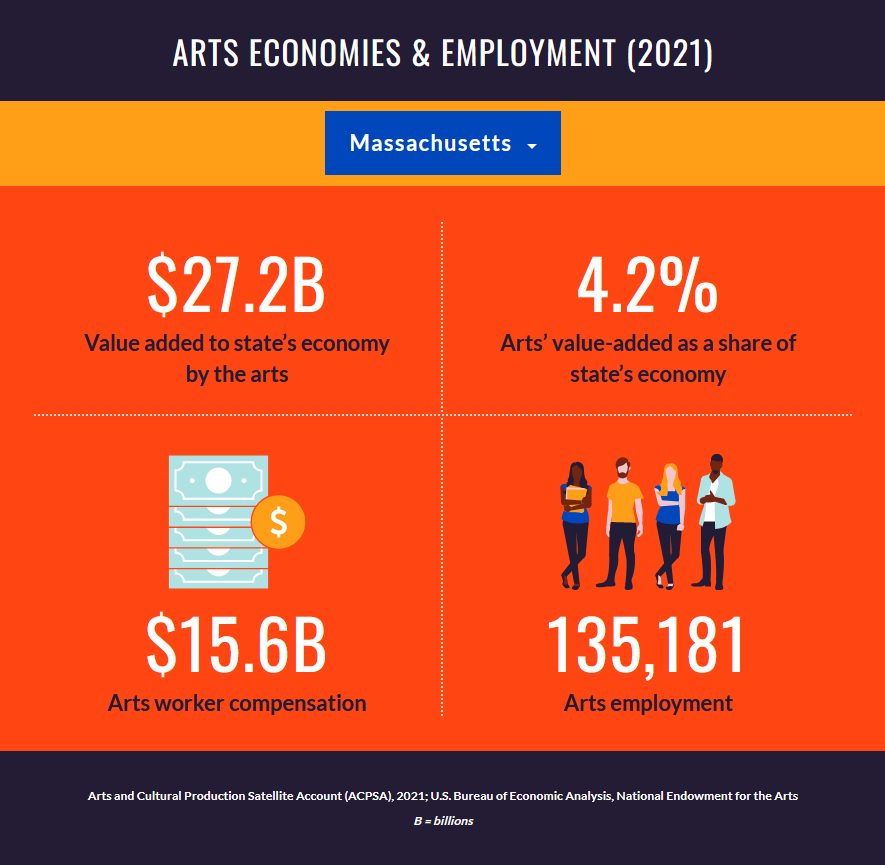
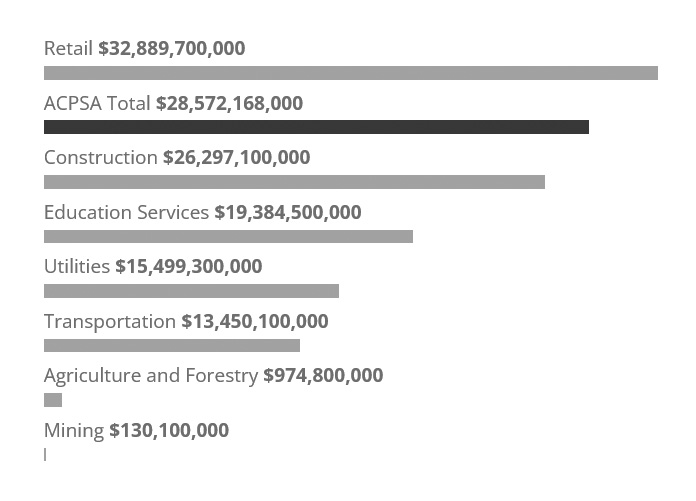
The U.S. Bureau of Economic Analysis (BEA) reports that in 2022 arts and cultural production in Massachusetts accounted for:
Arts and cultural value added in Massachusetts ranked 2nd among the comparison sectors. Comparison industries are selected industry categories using the North American Industry Classification System (NAICS) drawn from BEA’s 2022 state level data for employment (full-time and part-time workers), compensation and value added by industry. The comparisons are not mutually exclusive—arts and culture includes, for example, portions of other sectors such as construction and retail trade.
The NEA’s website details the findings in a number of resources, including a press release, national summary report, and state-level summary report.
BEA has produced ACPSA fact-sheets for each state.
The National Assembly of State Arts Agencies has created an interactive dashboard by state.