Power of Culture Blog
State Funding for Arts & Culture Reaches Record High
An update on the FY27 state budget and capital spending plan
Dawn Heinen, Digital Communications Manager
The National Endowment for the Arts (NEA), in conjunction with the U.S. Bureau of Economic Analysis (BEA), has released its annual update on the national and state-level contributions of the arts and cultural sector to the nation’s gross domestic product (GDP). The new data looks at the contributions of the arts and cultural industries in 2021, after the first year of COVID-19.
The data demonstrates the significant contribution of the arts and cultural industries to the national economy in 2021 while also underscoring the continued impact of the pandemic on the sector. The Arts and Cultural Production Satellite Account (ACPSA) tracks the annual economic value of arts and cultural production from 35 industries—including both commercial and nonprofit entities.
Analysis shows that several core arts industries did not return to pre-pandemic production levels in 2021. This group includes:
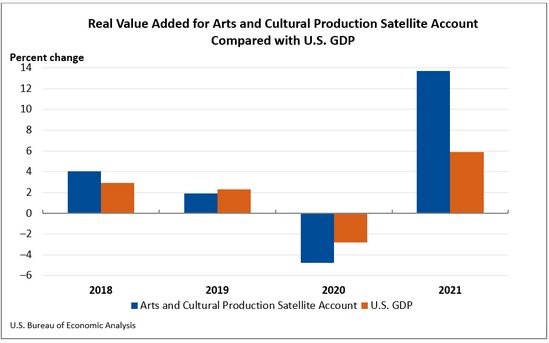
Despite setbacks for those industries, the overall national arts economy in 2021 represented 4.4 percent of GDP, or just over $1.0 trillion—a new high-water mark.
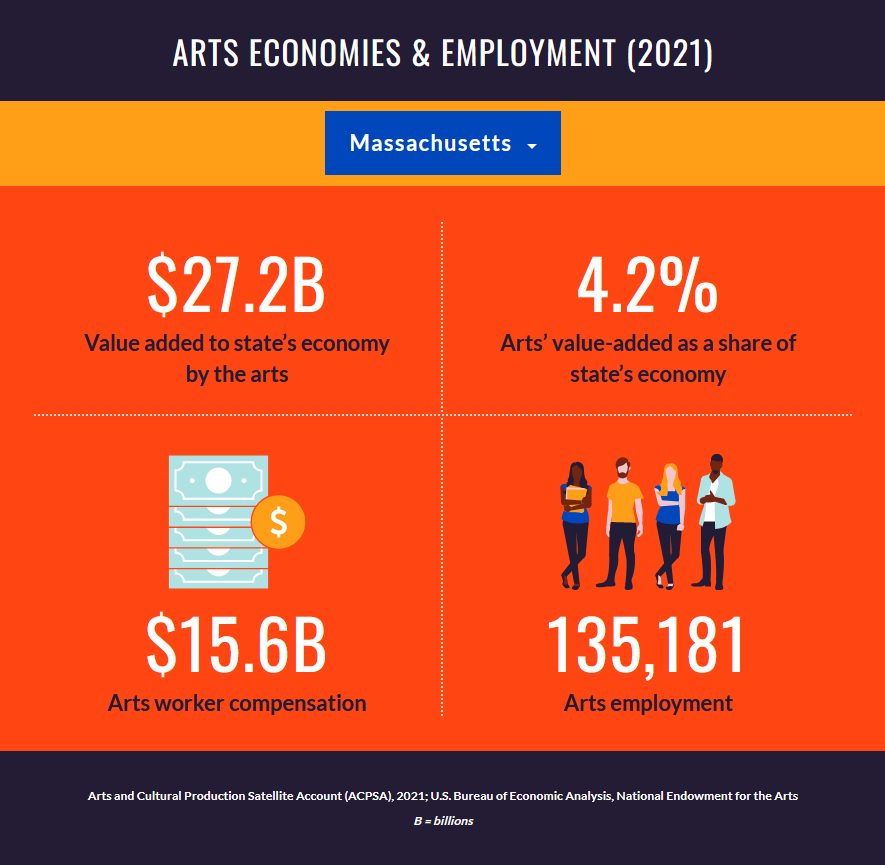
The U.S. Bureau of Economic Analysis reports that in 2021 arts and cultural production in Massachusetts accounted for:
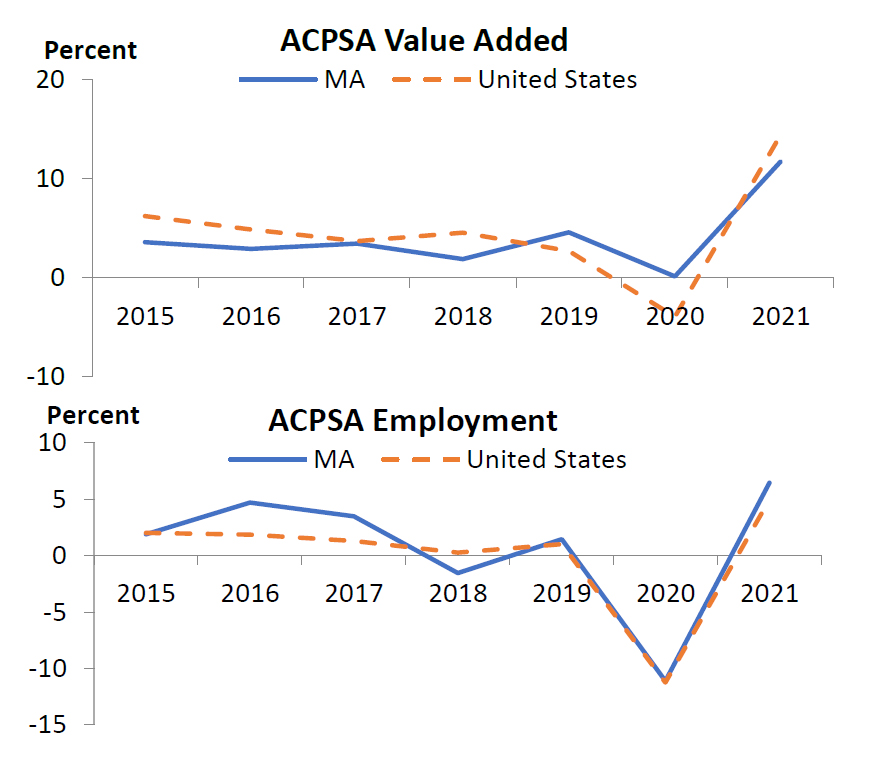
Trends in arts and cultural production: 2020—2021
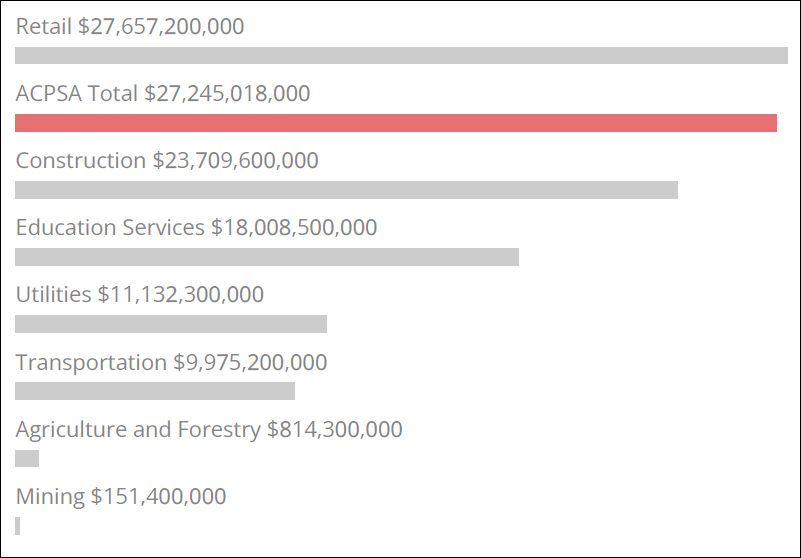
 Comparing Arts and Culture to Other Sectors of the Massachusetts Economy
Arts and cultural Value Added in Massachusetts ranked 2nd among the comparison sectors. Comparison industries are selected industry categories using the North American Industry Classification System (NAICS) drawn from BEA’s
2021 state level data for employment (full-time and part-time workers), compensation and value added by industry. The comparisons are not mutually exclusive—arts and culture includes, for example, portions of other sectors such as construction and retail trade.
The NEA’s website details the findings in a number of resources, including a press release, national summary report, and state-level summary report.
BEA has produced ACPSA fact-sheets for each state.
The National Assembly of State Arts Agencies has created an interactive dashboard by state.