Power of Culture Blog
Reflections on the Bicentennial, Boy Scouts, and America’s 250th
Acting Executive Director David Slatery's essay for Mass Humanities' “People’s Guide to the Revolution”
Dawn Heinen, Digital Communications Manager
Latest Data Reveal Continued Growth for the Arts Sector, But Struggles Remain Post Pandemic
The arts and cultural sector grew at more than twice the rate of the total economy between 2022 and 2023, according to new data from the Arts and Cultural Production Satellite Account (ACPSA), a product of the National Endowment for the Arts (NEA) and the Bureau of Economic Analysis (BEA).
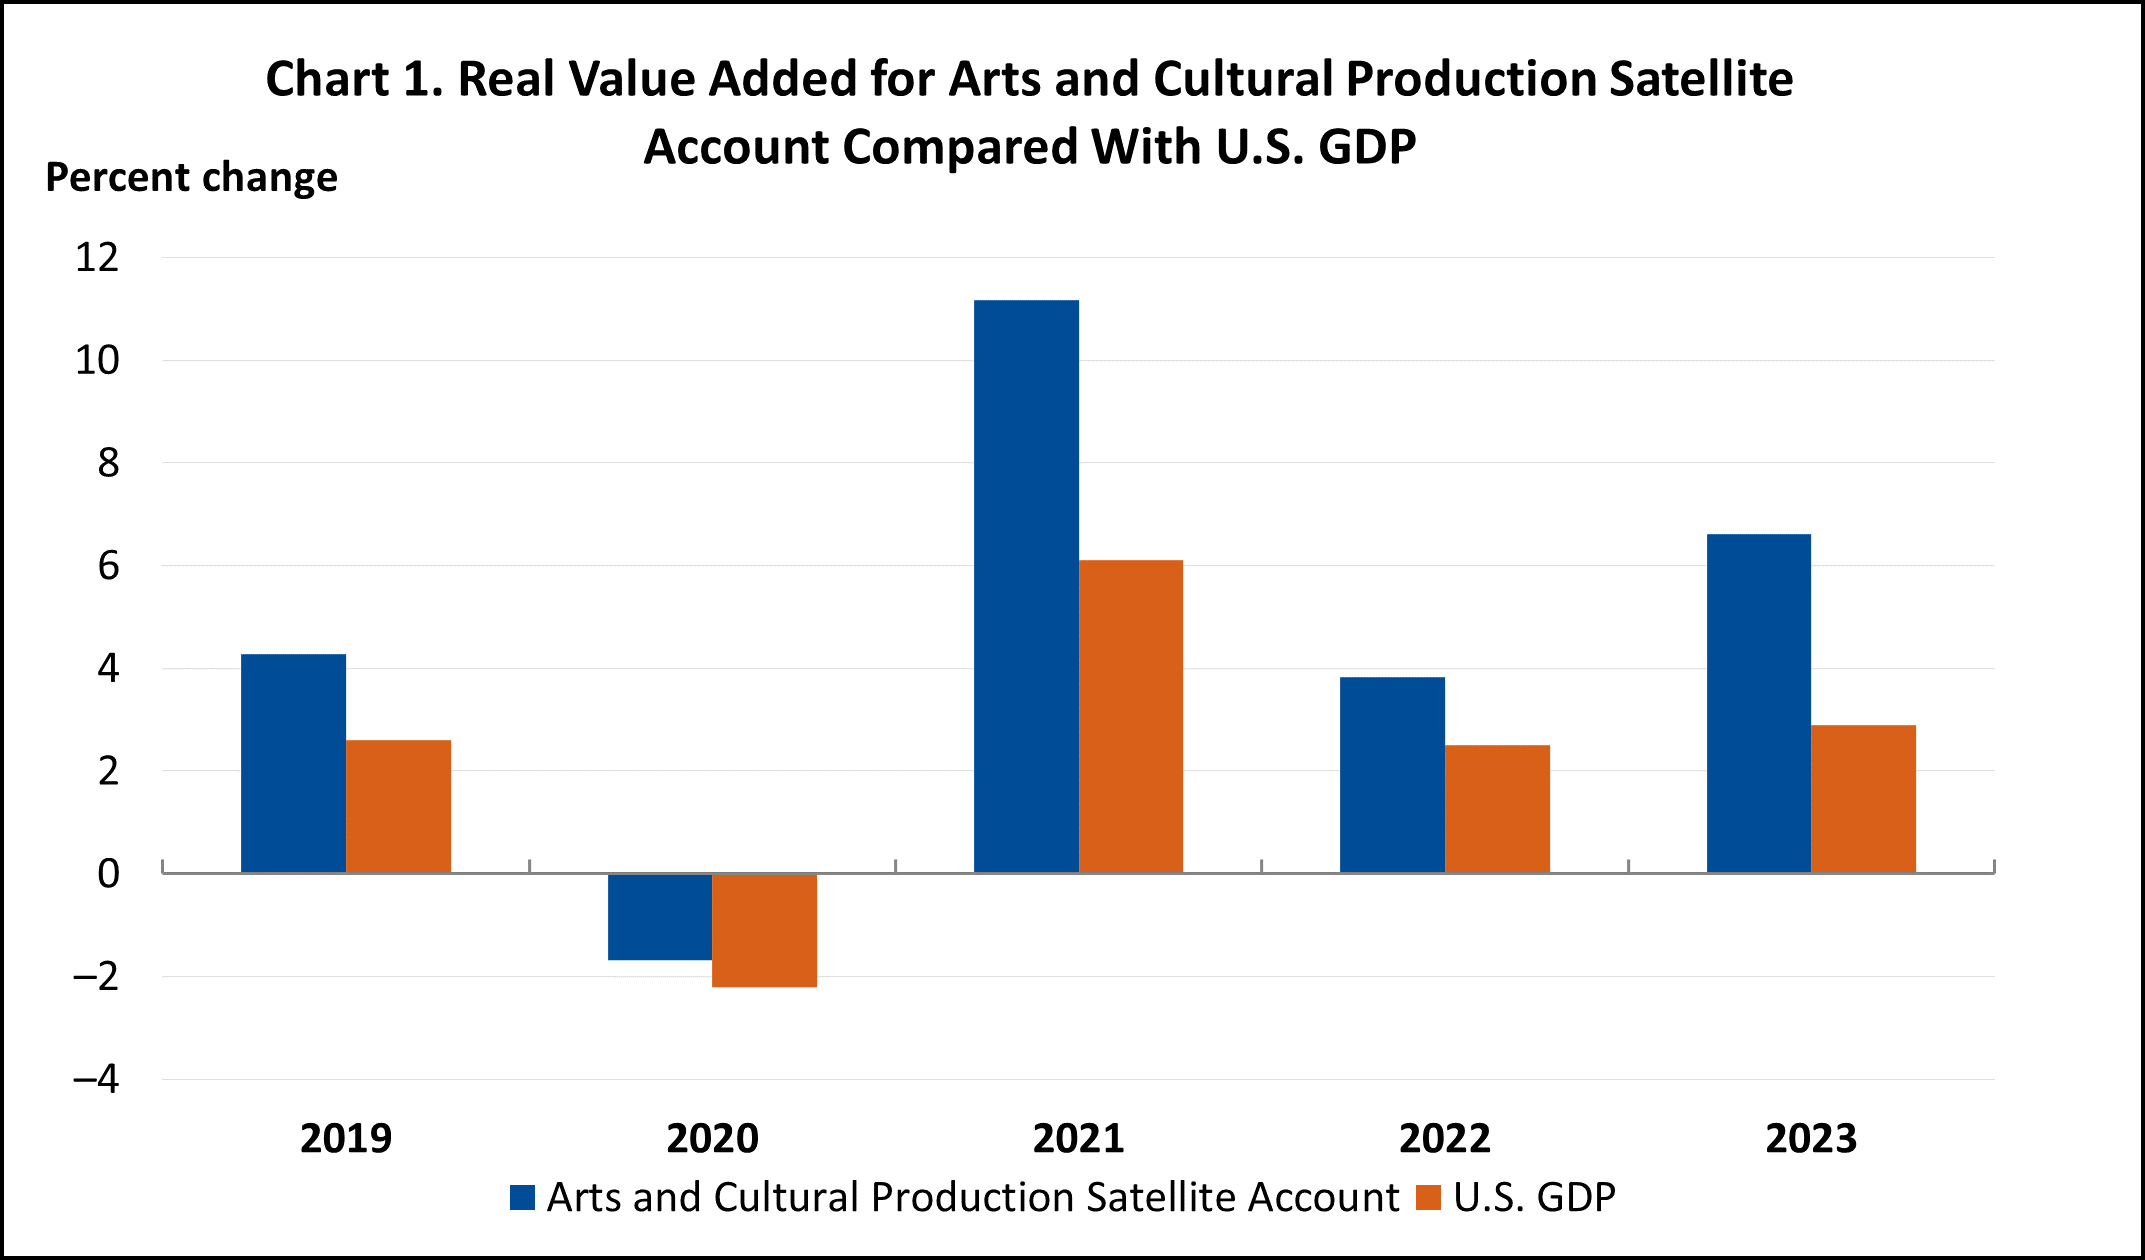
ACPSA tracks the annual economic value of arts and cultural production from 35 industry groups—including both commercial and nonprofit entities. In 2023, the most recent year for which data are available, arts and culture again surpassed its annual value added to the U.S. economy with $1.2 trillion, representing 4.2 percent of the nation’s GDP and supporting 5.4 million jobs. Most of the arts and cultural industries have exceeded their pre-pandemic numbers for value added; however, several are at or below their 2019 levels.
The real value added by arts and culture (i.e., in inflation-adjusted dollars) has doubled over a 25-year period. As in previous years, the arts added more to U.S. GDP than did the sectors of agriculture, forestry, fishing, and hunting; mining; outdoor recreation; and transportation and warehousing.
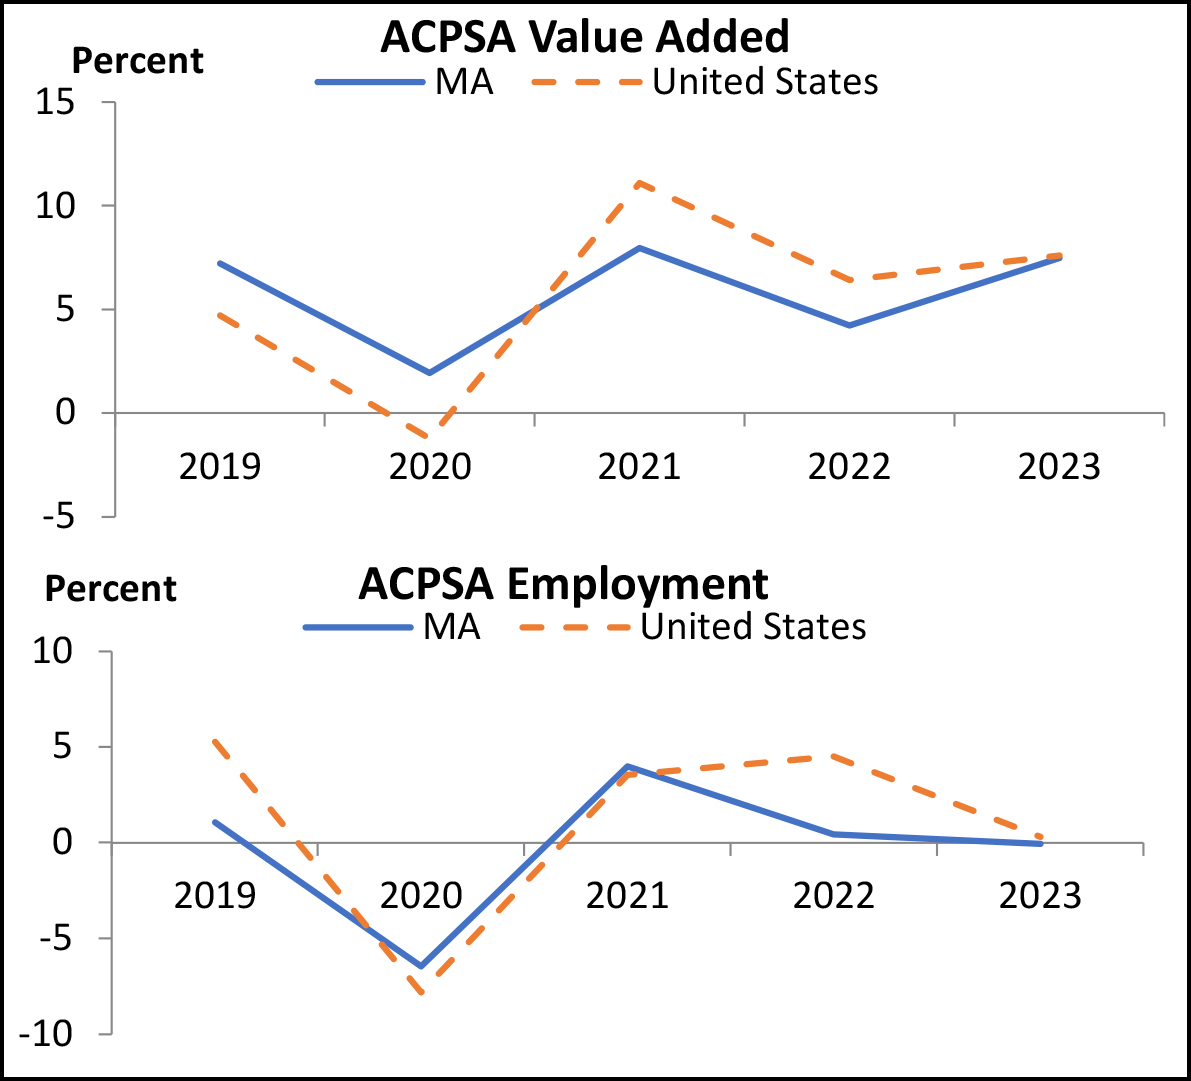
By 2023, most arts and cultural industries were restored to or exceeded pre-pandemic levels of economic activity, with 27 out of 35 arts industries posting amounts above 2019 levels. This includes the value added by performing arts presenters and agents and managers.
The value to national GDP of independent artists, writers, and performers was roughly on par with the 2019 level, though it represented a decrease from the 2022 level. Performing arts organizations—which took a bigger hit from the 2020 recession than did many other industries—grew 31.6 percent between 2022 and 2023 but remained 12.3 percent below the 2019 level in value added.
A national summary report and an accompanying interactive graphic is available, along with state-level estimates.
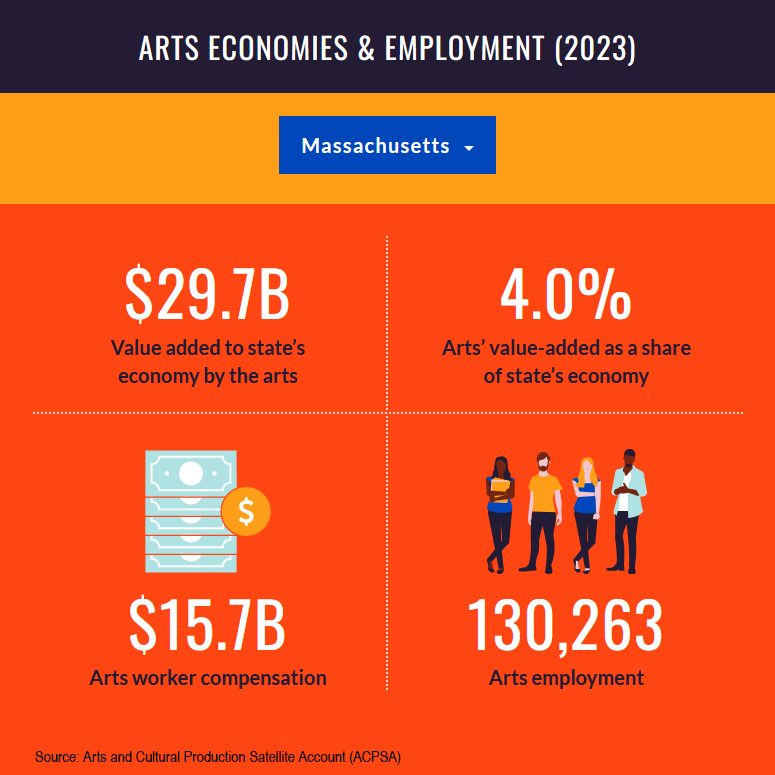
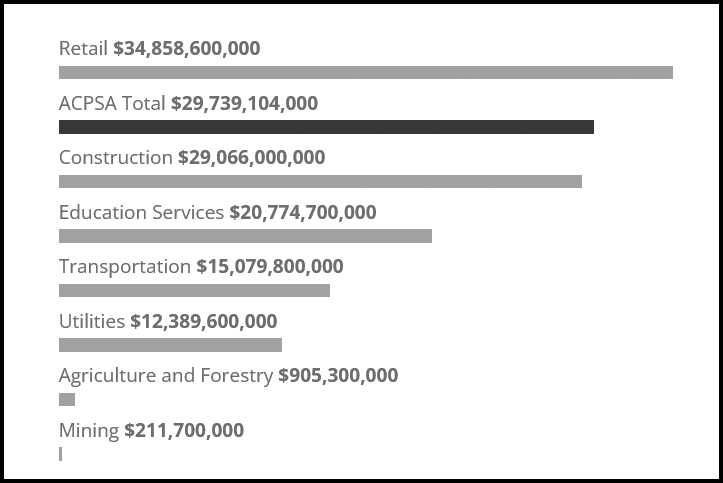
The U.S. Bureau of Economic Analysis (BEA) reports that in 2023 arts and cultural production in Massachusetts accounted for:
Arts and cultural value added in Massachusetts ranked 2nd among the comparison sectors. Comparison industries are selected industry categories using the North American Industry Classification System (NAICS) drawn from BEA’s 2023 state level data for compensation and value added by industry. Employment figures shown are from 2022, as 2023 data were not available at the time of publication. The comparisons are not mutually exclusive. For example, arts and culture includes portions of other sectors such as construction and retail trade.
The NEA’s website details the findings in a number of resources, including a press release, national summary report, and state-level summary report.
BEA has produced ACPSA fact-sheets for each state.
The National Assembly of State Arts Agencies has created an interactive dashboard by state.
2024 Cultural Asset Inventory – new data released by Mass Cultural Council quantifies size, scope, economic impact—and needs—of individual generators and cultural organizations statewide.